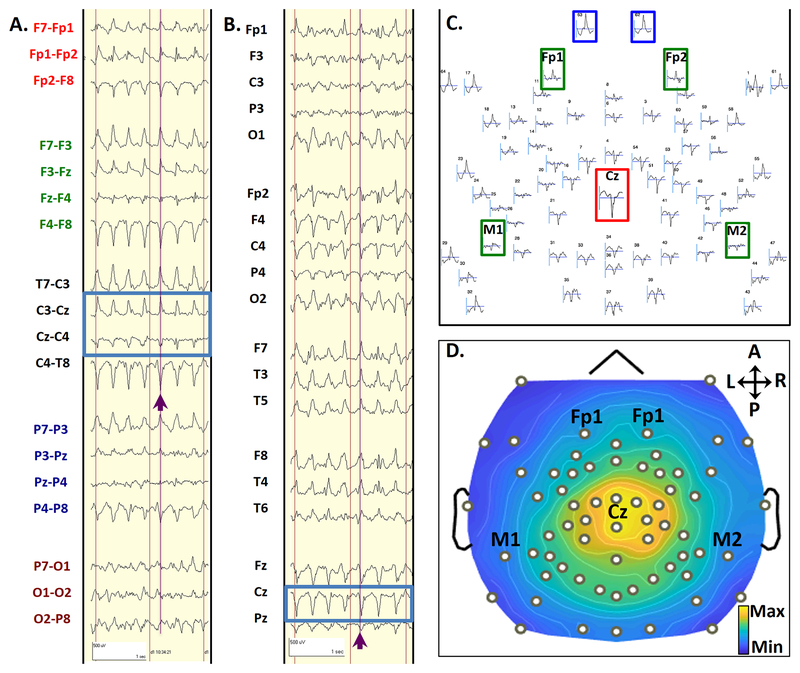
FIGURE 2: Topology of CPCs.
A typical CPC from seizure 2 in subject 1, in a bipolar transverse montage (2A) and an average referenced montage (2B). Purple lines and arrows highlight a single CPC, which occurred 13 seconds after seizure onset during Phase III of Seizure 2. Blue boxes highlight the phase reversal in bipolar montages (2A) and electrodes with maximal amplitude referenced to the average signal (2B). The scalp topography layout for this single CPC is shown in 2C. The topographic plot layout shows all 64 electrodes in relative space as they are distributed over the head, using an average reference. The standard electrode numbers for 64-channel high-density recordings are marked above each waveform. This complex showed a maximal positive voltage over the vertex (Cz, red inset) electrode and maximal negative voltage over sub-ocular electrodes 62 and 63 (blue insets). Electrode locations approximating those for conventional frontomastoid EEG are inset in green. Duration of display (represented by the horizontal gray bar below each waveform) is 300 ms. 2D shows a topographic voltage map of the peak amplitude of the CPC over a 2-ms time window, using an average reference. This voltage map displays the maximal positive voltages over the vertex and surrounding regions (red), and maximal negative voltages over the sub-ocular electrodes (blue). Black dots represent electrode locations, with selected 10–20 locations annotated. Signals have been bandpass filtered from 1–70 Hz.

