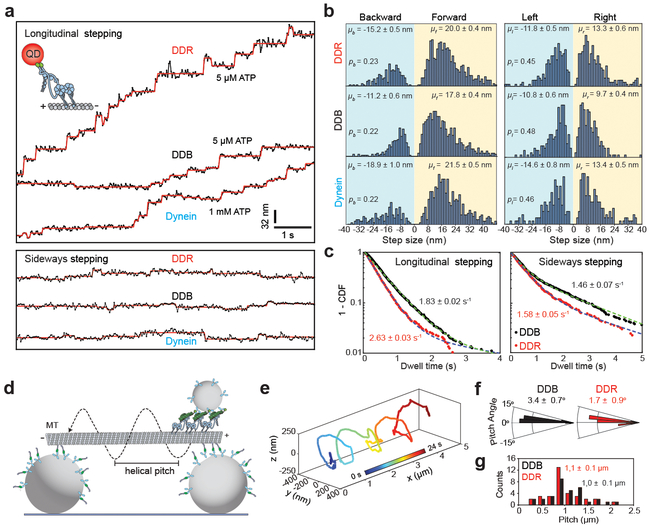
Figure 2. The stepping behavior of mammalian dynein-dynactin in unloaded conditions.
(a) Representative stepping traces of dynein, DDB, and DDR along longitudinal (top) and sideways (bottom) directions. Dynein was labeled with a QD at the N-terminus and its motility was tracked on surface-immobilized MTs at 33 Hz. Horizontal lines represent a fit to a step finding algorithm. n = 21, 19, and 14 for longitudinal and n = 18, 19, and 14 for sideways traces of DDB, DDR, and dynein respectively from 10 independent experiments for each complex. (b) Normalized histograms of longitudinal (left) and sideways (right) steps of dynein, DDB and DDR reveal the average step size in forward (μf), backward (μb), leftward (μl), and rightward (μr) directions (± s.e.m.) and the probability of stepping in backward (pb) and leftward (pl) directions. From top to bottom, n = 963, 1061 and 715 for longitudinal and 534, 463 and 331 for sideways steps. (c) Dwell time distributions of DDB and DDR. Dashed curves represent a fit to a two-exponential decay (decay rate ± s.e.). n = 1430, 963 for longitudinal and 684, 534 for sideways stepping of DDB and DDR, respectively. (d) Schematic of the MT bridge assay (not to scale). MTs are suspended above the coverslip by 2-μm-diameter beads. Motility of 0.5-μm-diameter cargo beads by multiple dynein-dynactin complexes was tracked in three dimensions. (e) An example trajectory of a DDB-driven cargo bead reveals helical motility around the circumference of an MT (n = 18 trajectories). (f) Histograms of helical pitch angles of DDB- and DDR-coated beads (mean ± s.e.m.). n = 32, 34 rotations for DDB and DDR respectively. Positive and negative angles correspond to the right- and left-handed helical movement, respectively. (g) Pitch distributions of DDB- and DDR-coated beads along MT bridges (mean ± s.e.m.). In f and g, n = 32 rotations for DDB (18 beads from eleven independent experiments) and 35 rotations for DDR (16 beads from six independent experiments).

