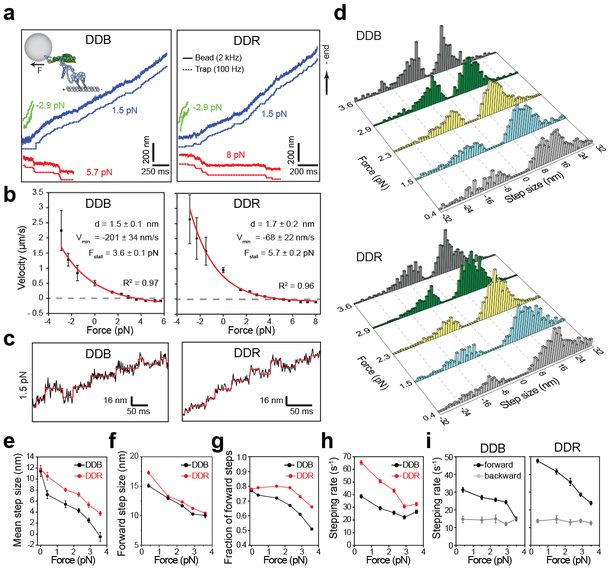
Figure 3. Velocity and stepping of mammalian dynein-dynactin under load.
(a) Example traces of bead movement driven by DDB and DDR in a force-feedback controlled trap under assisting (green trace), low hindering (blue trace), and superstall hindering (red trace) loads. (b) Force-velocity curves for DDB and DDR (mean ± s.e.m., n = 17, 21, 19, 22, 27, 27, 30, 25, 26, 24, 17, 15, 15, 19, 20, 20, 22, 24, 24, 23, 30, 21, 18 runs from left to right, three independent experiments per condition). Velocities at 0 pN load were obtained from fluorescence measurements (nDDB = 209, nDDR = 223). Red curves represent a fit to a one-state model, in which the backward stepping is load independent. Uncertainties in the parameters of the fit correspond to s.e. (c) Representative traces of single beads driven by DDB and DDR under 1.5 pN hindering load. Horizontal lines represent a fit to a step-finding algorithm. (d) Normalized step size histograms of DDB and DDR under load. (e) The mean step size, (f) forward step size, (g) the fraction of forward steps, (h) overall stepping rate and (i) the breakdown of forward and backward stepping rates of DDB and DDR under constant hindering loads. In d-i, n = 480, 619, 1025, 709, 352 for DDB and 501, 1263, 1129, 792, 741 for DDR from 0.4 to 3.6 pN (three independent experiments). The values at 0 pN were obtained from fluorescence measurements in Figure 2. Error bars are s.e.m. in e and s.e. from a single exponential decay fit in g-h.

