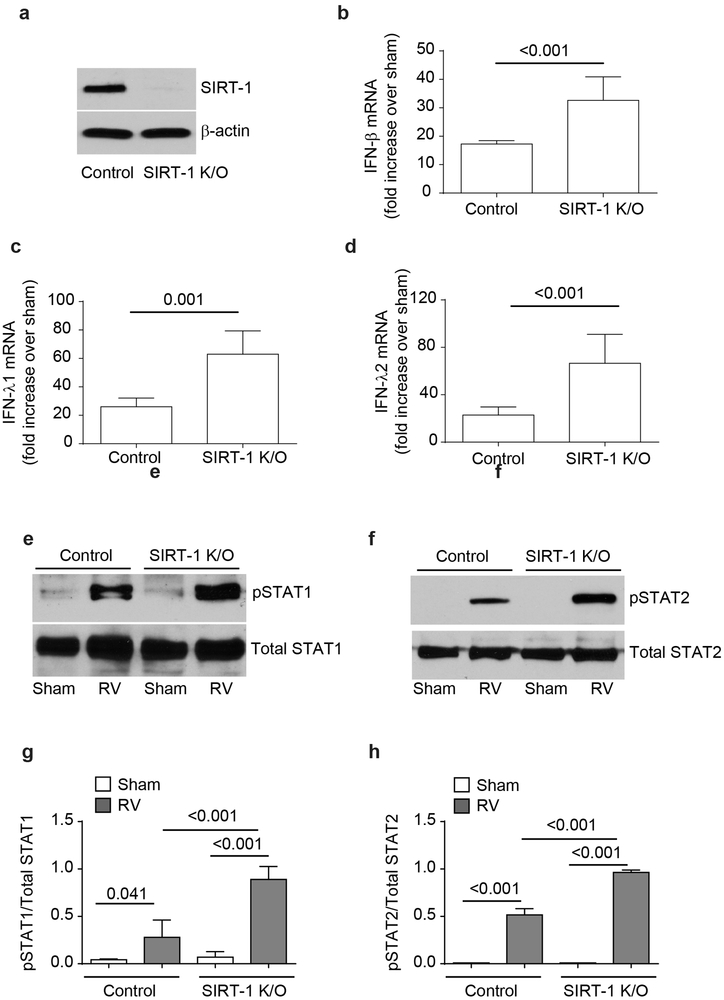
Figure 5.
SIRT-1 knockout cells show exaggerated IFN responses to RV infection. Cell lysates from control or SIRT-1 knockout cells were subjected to Western blot analysis with SIRT-1 to confirm knockdown of SIRT-1 (a). SIRT-1 knockout or control cells were infected with RV and after 24h, mRNA expression of IFN-β, IFN-λ1 and IFN-λ2 was assessed by qPCR, IFN expression was normalized to G3PDH and then expressed as fold increase over sham (b – d). In some experiments, total proteins from Sham or RV-infected control and SIRT-1 knockout cells was subjected to Western blot analysis with total and phopho-STAT1 and STAT2 antibodies (e and f) and band intensities were quantified and expressed as ratio of phopho-STAT/total STAT (g and h). Images are representative of 4 independent experiments. Data represents average ± SEM calculated from 4 independent experiments (b – d, g and h). Data was analyzed by unpaired T test (b – d) or by ANOVA (g and h).

