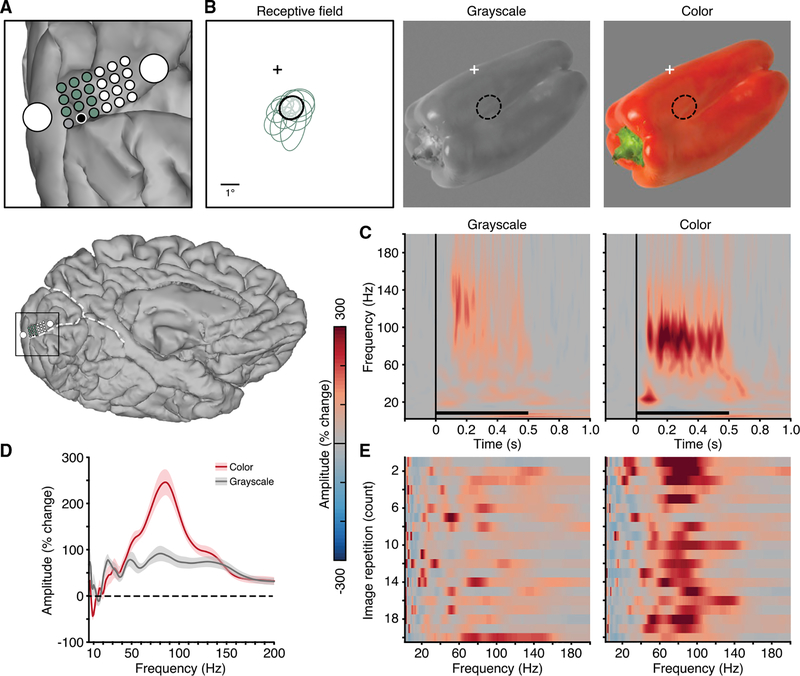
Figure 7. Experiment 4: Spectral Response Differences to Color and Grayscale Image.
(A) Electrode location of macro- and mini-ECoG grid in subject N10 (whole brain location shown below for reference). Mini-ECoG electrodes with an identified receptive field are shown in green and black (gray electrode was excluded due to poor signal).
(B) Receptive fields of the 11 mini-ECoG electrodes highlighted in (A). Receptive fields are given by Gaussian fits to the data [30, 42]. The receptive field location of the black electrode in (A) is shown with respect to fixation (cross) and overlaid on both the grayscale and color images (middle and right panels; luminance values 23.8 and 24.4 cd/m2, respectively; note: this is a cropped view of the full monitor display).
(C) Mean spectrogram response for the grayscale (left) and color (right) image versions (black electrode in A; color maps reflect % change in amplitude relative to the pre-stimulus period; black line indicates stimulus presentation).
(D) Mean normalized amplitude spectra (% change, averaged in the 250- to 500-ms post-stimulus window; shading reflects SEM) for the grayscale and color image versions.
(E) Single-trial amplitude spectra (% change, averaged in the 250- to 500-ms post-stimulus window) for each image repetition (20 repetitions; y axis) for the grayscale (left) and color (right) image versions, showing the consistency of the spectral response to repeated presentations of the same image (non-consecutive repetitions). Although the grayscale image drives a clear BBG response, the colored image drives an additional NBG peak.

