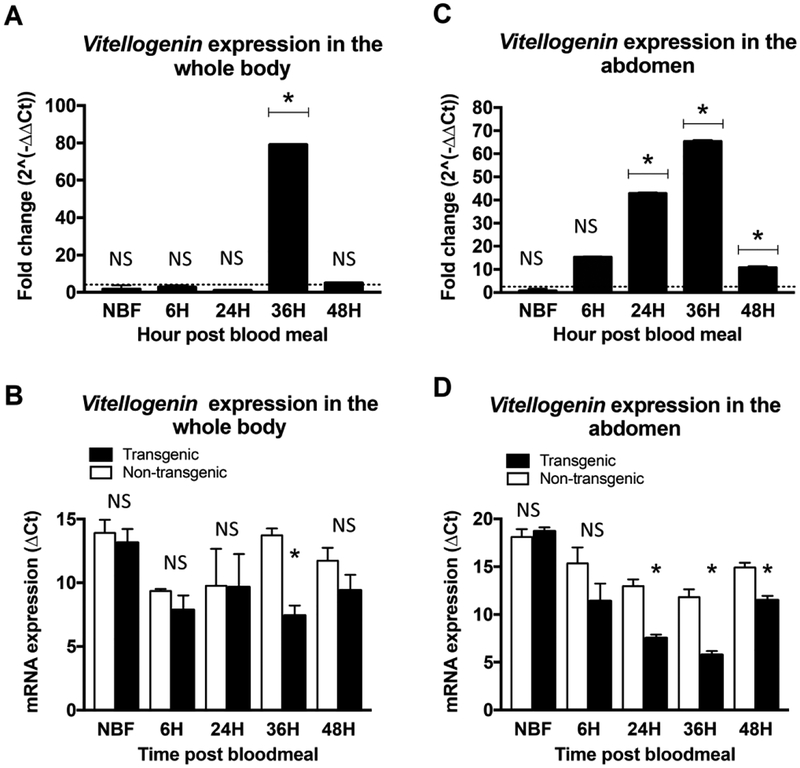
Figure 4: Overexpression of myr-AsteAkt-HA expression in the abdominal fat body induced vitellogenin 1/2 (Vg1/2) transcript expression.
Whole bodies (A and B) and Abdominal body walls (C and D) from 3 to 5 days old TG and NTG A. stephensi females were used to assess transcript expression of Vg1/2 at 0h (non-blood fed, NBF), 6h, 24h, 36h and 48h after a blood meal. Vg1/2 expression was quantified by qPCR. NTG samples were used as a control for each time points for the relative transcript expression determination. The dotted line on the graphs represents transcript levels in the NTG control samples normalized to one. The Y-axis represents the log2 of fold changes, which were calculated by the 2^−ΔΔCt method in which the Ct values of TG gene were normalized to the level of NTG control within each time point. Each value is the mean ± SEM of three independent experiments from five pooled mosquito heads. Results were analyzed using Student’s paired t-test (* = p<0.05) to determine differences between TG mosquitoes and NTG sibling controls. All expression studies were replicated a minimum of three times.

