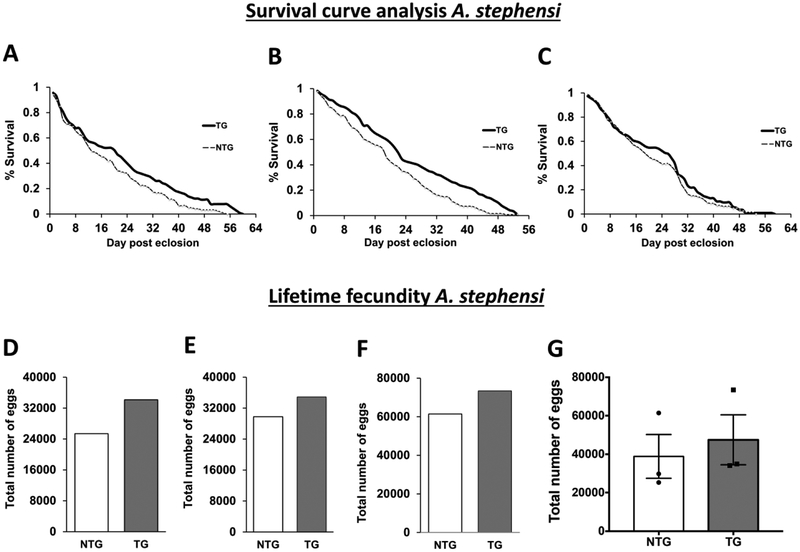
Figure 5: Impact of myr-AsteAkt-HA overexpression in the abdominal fat body on lifetime fecundity.
A-C) Survivorship curves of A. stephensi NTG and TG mosquitoes reared under identical conditions and provided with a blood meal daily in addition to 10% dextrose solution ad libitum. Each survivorship curve represents the data from a single biological replicate using a minimum of 100 TG and NTG female mosquitoes. Significant differences between TG and NTG survival curves were assessed using Log-rank (Mantel-Cox) analysis and were observed in replicates 1 (A p=0.013) and 2 (B p=0.0067). Replicate 3 was not significant (C = =0.3161) D-F) Graphs represent total egg production of each cage of TG and NTG sibling mosquitoes throughout their lifespan and are matched to the survival curves in A-C. G) Graph represent total egg production from all three independent experiments between TG and NTG sibling mosquitoes throughout their lifespan. Significant differences were observed in the lifetime fecundity between TG and NTG using Student’s paired t-test (p<0.05; Graphpad Prism 7). Each graph represents the total number of eggs collected from an independent experimental caged population.

