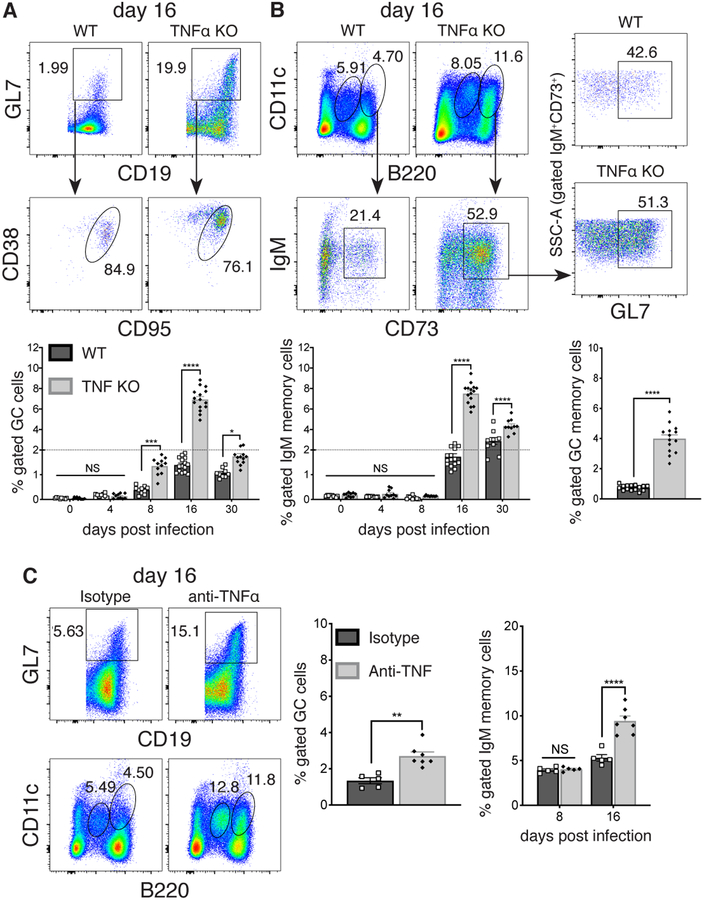
FIGURE 1. Early T-bet+ IgM memory cells underwent expansion and exhibited characteristics of GC B cells in the absence of TNFα.
C57BL/6 and congenic TNFα-deficient mice were infected with E. muris and B cells were analyzed by flow cytometry on day 16 post-infection. (A) Splenic GL7+ CD19+ CD38lo CD95+ B cells were monitored on days 0, 4, 8, 16 and 30 post-infection. Representative flow cytometry dot plots from day 16 post-infection are shown at the top; cumulative data are shown in the plots below. (B) CD11c+, B220+, IgM+, and CD73+ memory cells were also characterized. Representative flow plots and cumulative data are shown on the left; expression of GC markers on CD11c+ CD73+ B cells from WT and TNFα-deficient mice is shown in the right panels.
(C) Mice were administered either an anti-TNFα mAb, or an isotype-matched irrelevant mAb, every other day, for 8 or 16 days following infection, and B cells were analyzed by flow cytometry, as in A and B. The data in A-C were pooled from at least three or more experiments (n=3). Statistical significance was determined in A (p<0.0001), B (bottom left graph, p<0.0001), and C (far right graph, p=0.0001), using a multiple-comparison two-way ANOVA with Tukey’s multiple comparison test; or in B (bottom right graph, p<0.0001) and C (left graph, p=0.0011) using a two-tailed unpaired t-test. All statistical significance is indicated by asterisks (*p>0.03, **p>0.002, ***p>0.0002, ****p<0.0001). The dashed line in the graphs from A and B indicates a change in the numbering order on the y-axis.

