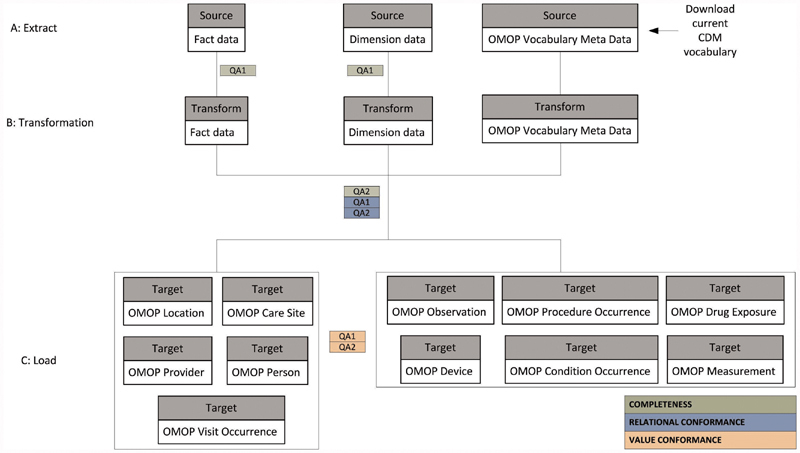
Fig. 1.

A summary of the data flow from the extract of the source data warehouse, through transformation, and loading into the OMOP data tables. The figure is generic to represent any fact or dimension table appropriate at that stage of ETL. The colors represent the QA element assessed at each stage. ETL, extract, transform, load; OMOP, Observational Medical Outcomes Partnership; QA, quality assurance.
