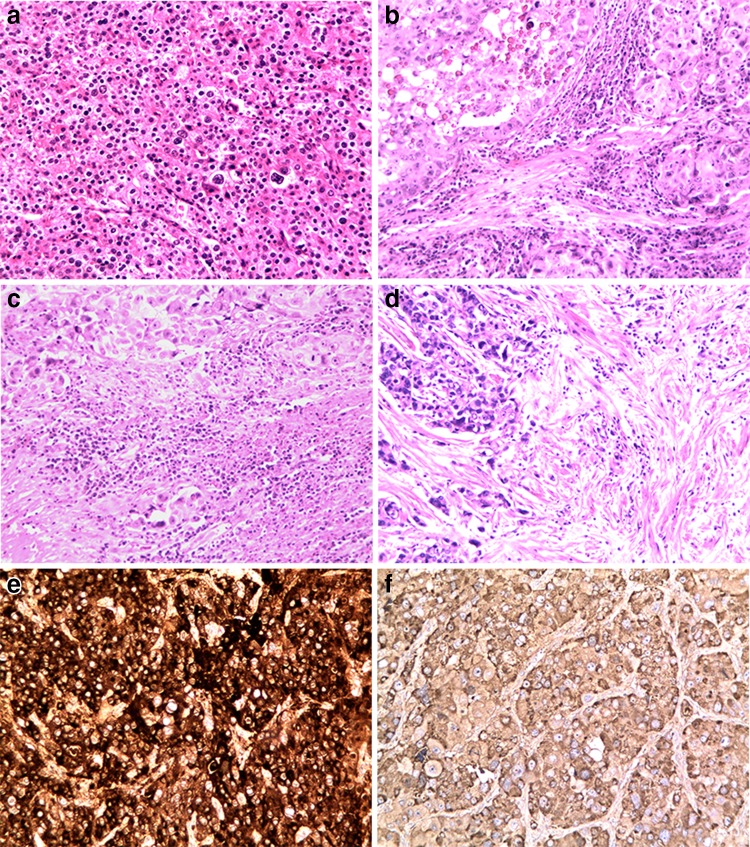
Fig. 1.
HAS samples with different HAS cell component percentages and different AFP immunohistochemical reactivity scores. a 100% HAS cells; b 50% HAS cells, with a classic rich cytoplasmic glycogen content and transparent bodies; c 25% HAS cells; d 10% HAS cells; e strong tumour staining; f weak tumour staining

