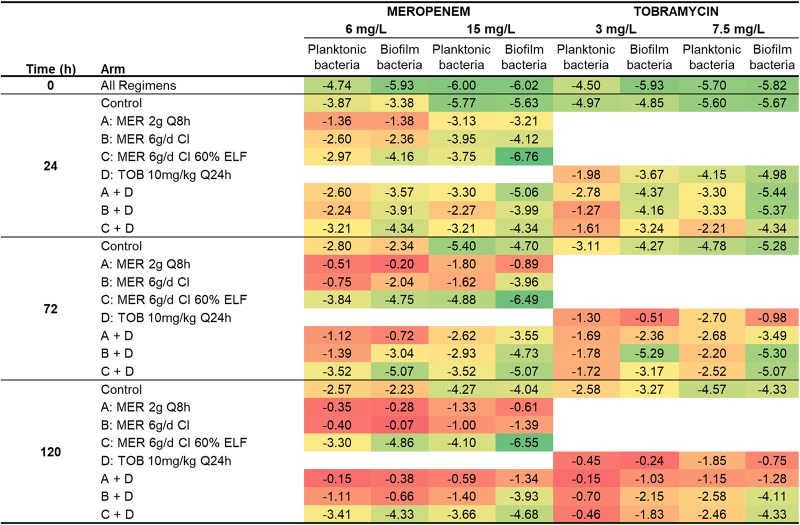
TABLE 3.
Log10 mutation frequencies at 6 mg/liter and 15 mg/liter meropenem and 3 mg/liter and 7.5 mg/liter tobramycin for each simulated regimen
MER, meropenem; TOB, tobramycin. The red background indicates a high mutation frequency, i.e., a large proportion of less-susceptible bacteria being present in the total population; the green background indicates a low mutation frequency, i.e., a small proportion of less-susceptible bacteria being present in the total population.

