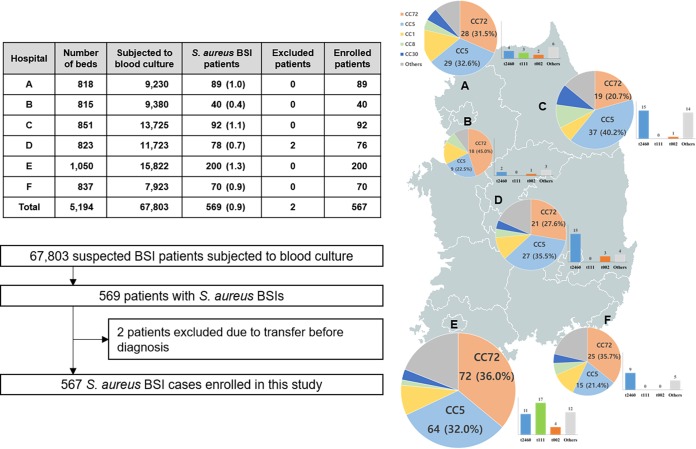
FIG 1.
Geographical distribution of S. aureus BSI cases included in this study. The number of beds, patients subjected to blood culture, and S. aureus BSI cases are indicated in the table. The pie charts indicate the proportions of the major sequence types of the S. aureus blood isolates, and the relative size of the pie chart indicates the number of S. aureus BSI episodes. The bar charts indicate the numbers of CC5 tst-1-positive MRSA isolates grouped according to the spa types in each hospital.

