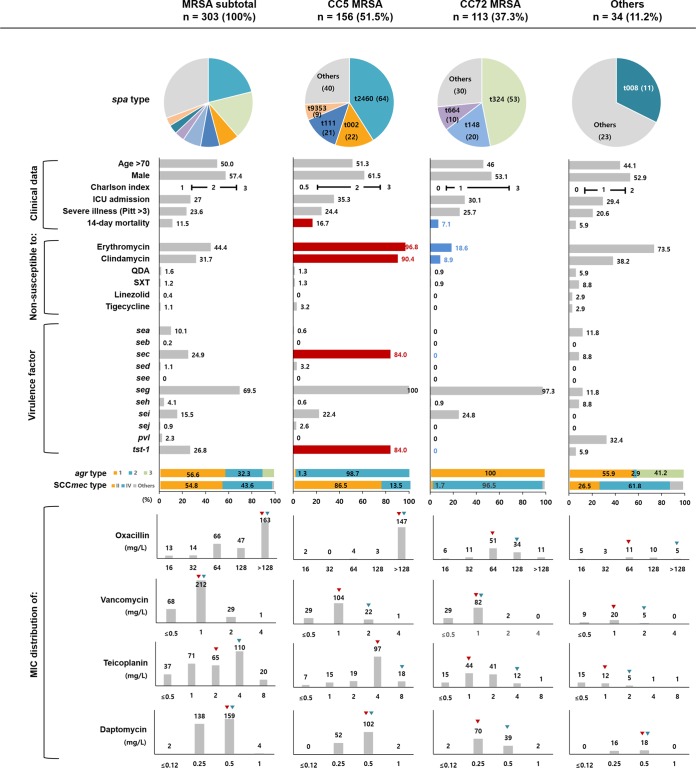
FIG 2.
Distribution of host- and pathogen-related factors in patients with MRSA bloodstream infections stratified according to strain type. The pie charts indicate the proportions of major spa types. Horizontal bar charts indicate the proportion of isolates for each variable, and colored bar charts and numbers indicate significant differences in proportions between CC5 and CC72 MRSA isolates (red, more prevalent; blue, less prevalent). Vertical bar charts indicate the MIC distributions of oxacillin, vancomycin, teicoplanin, and daptomycin, and red and green triangles represent the MIC50 and MIC90, respectively.

