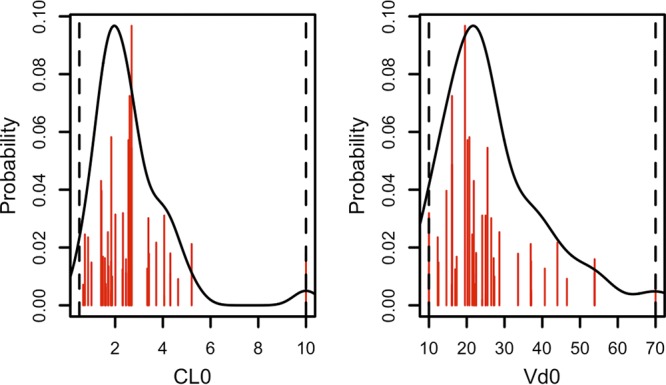
FIG 1.

A priori amikacin clearance (left) and volume of distribution (right). CL0, typical clearance in liters/h; Vd0, typical volume of distribution in liters. Red lines represent the discrete nonparametric distribution of PK parameters, the black lines represent their smooth density function, and dotted vertical lines represent the parameter ranges.
