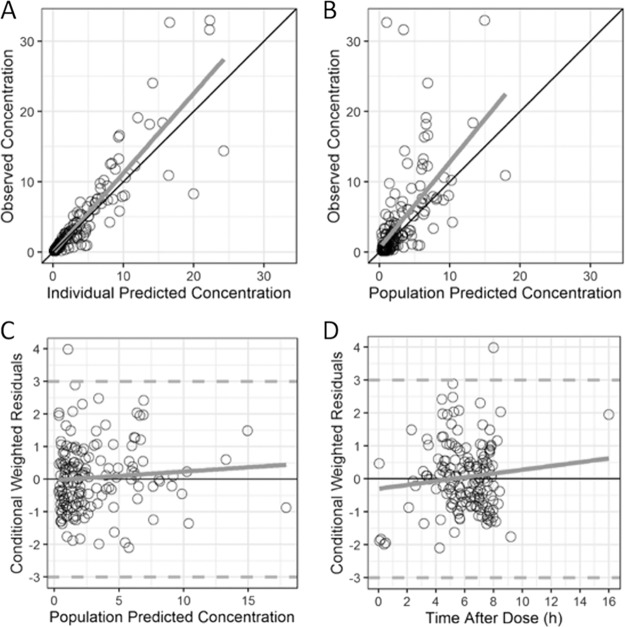
FIG 3.
Goodness-of-fit plots for the final tazobactam model. The final tazobactam diagnostic plots are of the observed versus individual predicted concentrations (A) or population predicted concentrations (B) and the conditional weighted residuals versus the population predicted concentration (C) or the time after the dose (D).

