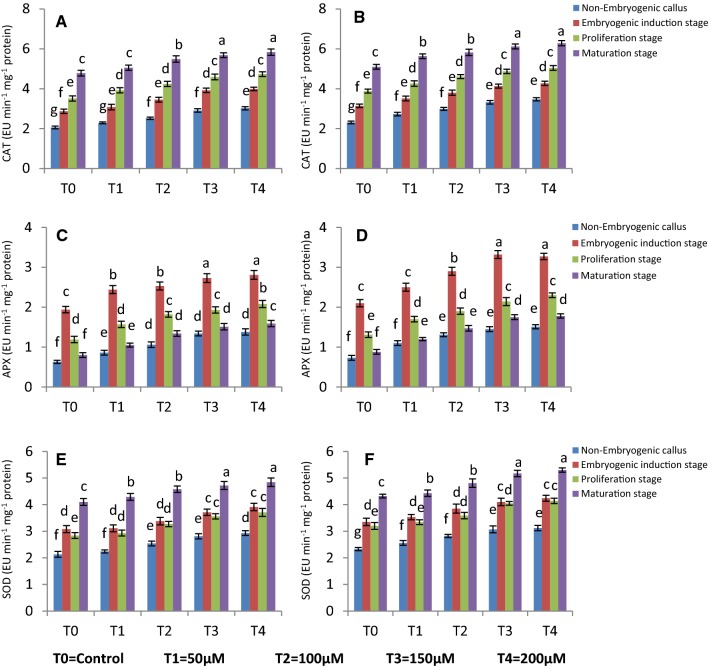
Fig. 6.
Effect of different concentrations of MeJA on a, b catalase activity; c, d APX activity; e, f SOD activity of different stages in CO-1 and RS respectively after 3weeks. Values are mean ± standard deviation of three experiments. Mean values in the bars followed by different letters are significantly different (at p = 0.05) according to DMRT

