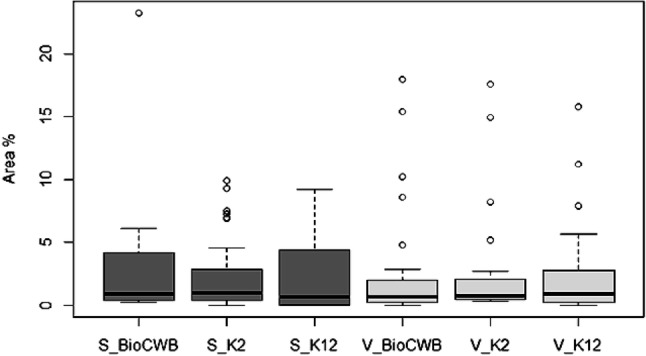
Fig. 3.

Comparisons of volatiles and soluble metabolites released by Bacillus spp. The figure represents total number of soluble metabolites (denoted “S”; dark-grey) and volatile metabolites (denoted “V”; light-grey) released by B. subtilis BioCWB, B. luciferensis K2 and B. amyloliquefaciens K12
