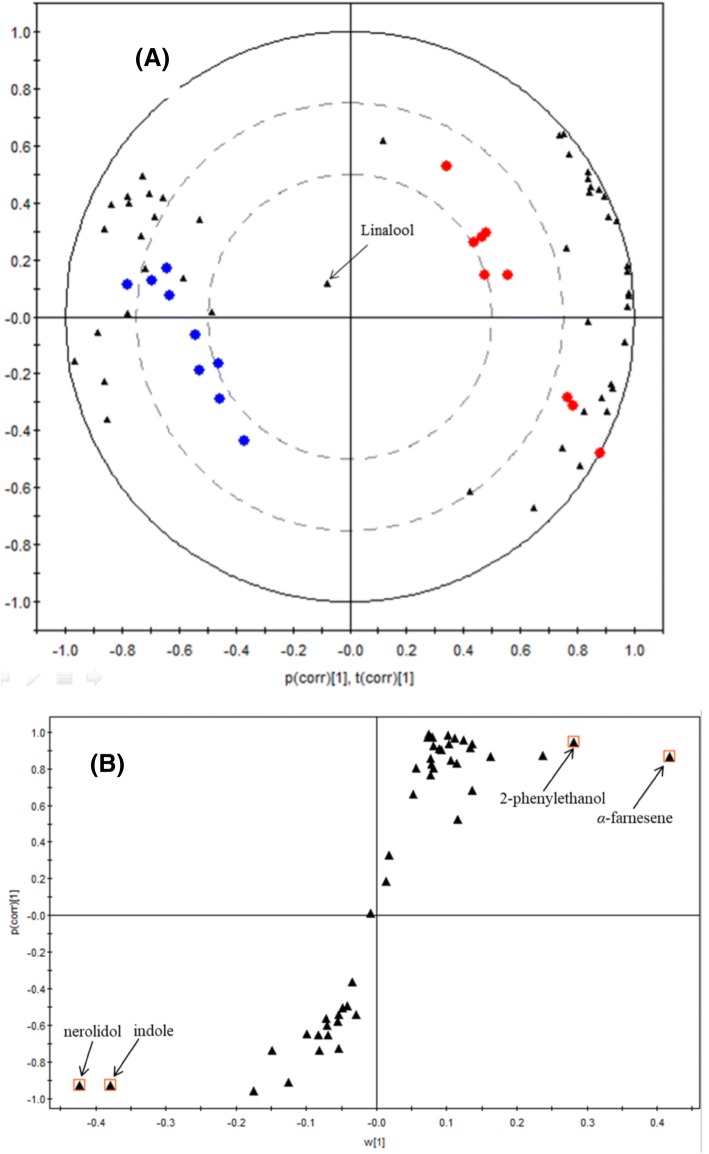
Fig. 1.
Multivariate analysis of headspace volatiles for dry leaves and tea infusions. (A) PC1 versus PC2 bi-plot, combined with observation scores and variable loadings. ‘Red circle’: dry leaves; ‘blue circle’: tea infusion; ‘filled triangle’: volatiles. (B) S-plot with interesting volatiles most responsible for orthogonal variation highlighted by the red squares. ‘filled triangle’: volatiles. (Color figure online)

