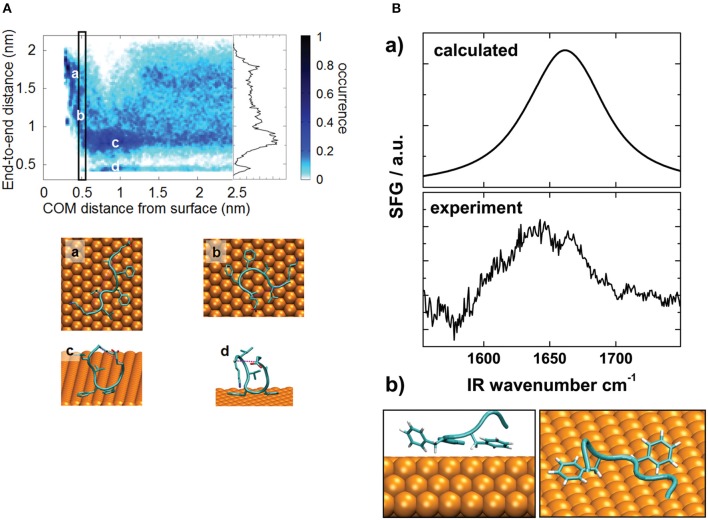
Figure 2.
(A) Distribution fraction of peptide end-to-end distance (computed considering terminal Cα atoms) as a function of peptide–surface distance. The rectangle identifies the free energy minimum as a function of the peptide–surface distance. The inset represents the distribution of the end-to-end distance in the bulk region (COM distance from the surface larger than 1.25 nm). (a–d) show representative conformations. (B) Comparison between calculated and experimental SFG spectra (a) and simulated structure used for spectral calculation (b). Reproduced from Bellucci et al. (2016) under a CC-BY 3.0 license. Published by the Royal Society of Chemistry.

