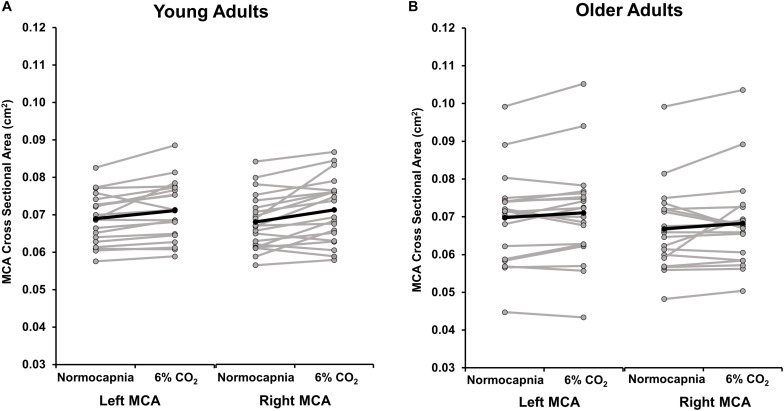
FIGURE 4.
This image displays the cross sectional area (CSA) of the left and right middle cerebral artery (MCA) during normocapnia and hypercapnia (6% CO2 inhalation) in (A) young and (B) older adults. The group average response is shown in black. Gray lines demonstrate individual responses. On average, the left MCA CSA significantly increased from normocapnia to 6% CO2 in young adults (p = 0.004) but the change in CSA was not significant in older adults (p = 0.08). The right MCA CSA significantly increased from normocapnia to 6% CO2 in young adults (p = 0.002) but the change in CSA was not significant in older adults (p = 0.19). There were no differences in the response to hypercapnia between the right MCA CSA compared with the left MCA CSA in young (p = 0.28) and older (p = 0.72) adults.

