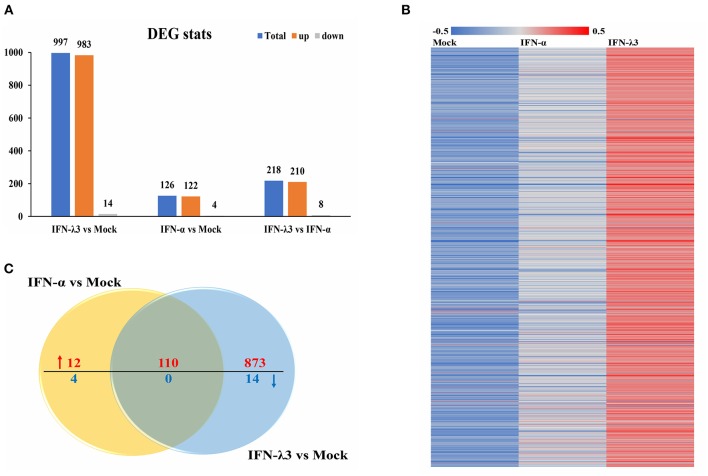
Figure 2.
Comparative transcriptome analysis of IFN-λ3- or IFN-α-treated IPEC-J2 cells. (A) The graph of statistical results of IFN-λ3 or IFN-α differential expression. IPEC-J2 cells were primed or not primed with IFN-λ3 (1,000 ng/ml) and IFN-α (1,000 ng/ml) for 24 h. Then, the total RNA isolated from the cells was used for RNA sequencing. (B) The heat map of gene expressed induced by IFN-λ3 or IFN-α. (C) The venn map analysis of common differentially expressed genes elicited by IFN-λ3 or IFN-α.

