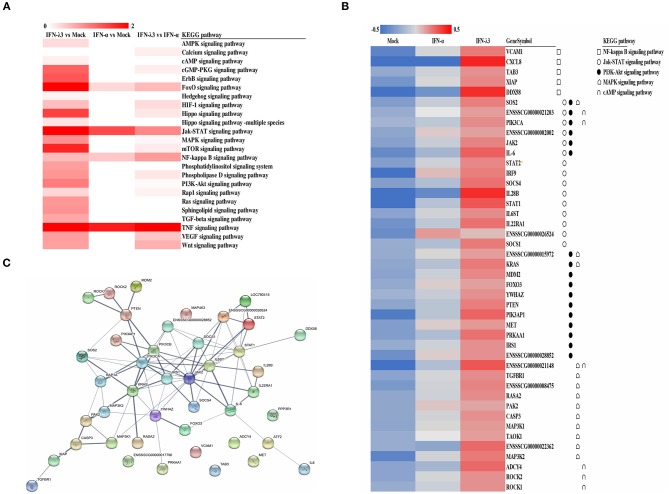
Figure 4.
KEGG pathway enrichment and interaction analysis of differentially expressed genes induced by IFN-λ3 or IFN-α. (A) KEGG pathway enrichment analysis of differential genes induced by IFN-λ3 or IFN-α. The differential genes induced by IFN-λ3 or IFN-α were analyzed using software kobas3.0. (B) The expression heat map of differential expression genes induced by IFN-λ3 or IFN-α. The RPKM values of differentially expressed genes of IFN-λ3 or IFN-α were extracted, and the same set of different replicates was averaged. The average of the RPKM values of all samples of a certain gene was calculated, and the heat map was made by log 10 (the average RPKM value of a certain gene of each group/the average RPKM value of the gene). The KEGG pathway to which the gene belongs is indicated by a different symbol. (C) Protein interaction prediction analysis of differentially expressed genes by string database. The relevant genes were input into string (http://www.string-db.org/), the active interaction sources were selected as homology, and the experimentally determined interaction and database annotated were used as predictive conditions for protein interaction prediction. The thickness of the line represents combined score, which is the combined score of the prediction results of the three prediction conditions, indicating the strength of data support.

