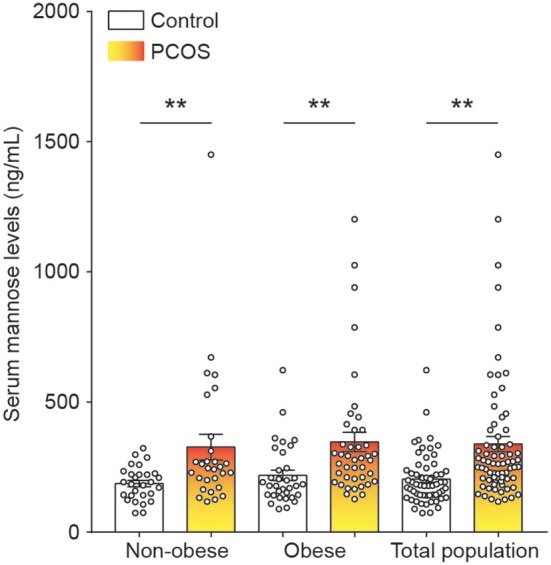
Figure 1.

Mannose levels in serum of control subjects and PCOS patients. Differences in serum mannose levels between non-obese and obese control subjects and PCOS patients. Bar graphs show the mean ± standard error. **P < 0.01 vs. control. PCOS, polycystic ovary syndrome.
