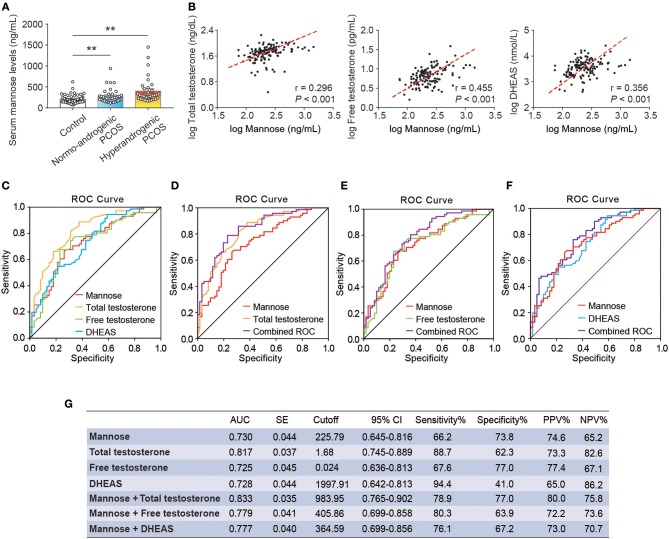
Figure 2.
Correlation and ROC analysis between serum mannose and androgens. (A) Differences in serum mannose levels in control subjects, normo-androgenic PCOS patients, and hyperandrogenic PCOS patients. (B) Correlation between serum total testosterone and free testosterone, and DHEAS and mannose levels, respectively. Both parameters were log-transformed for the plot. (C–G) Diagnostic potential of serum mannose, total testosterone, free testosterone, and DHEAS estimated using ROC analysis. ROC curve analysis of the individual androgens, and combining the individual androgens with mannose, respectively. AUC, cutoff value, sensitivity, and specificity are indicated. Bar graphs show the mean ± standard error (SE). **P < 0.01 vs. control. PCOS, polycystic ovary syndrome; DHEAS, dehydroepiandrosterone sulfate; ROC, receiver operating characteristic; AUC, the area under the curve; CI, confidence interval; PPV, positive predictive value; NPV, negative predictive value.

