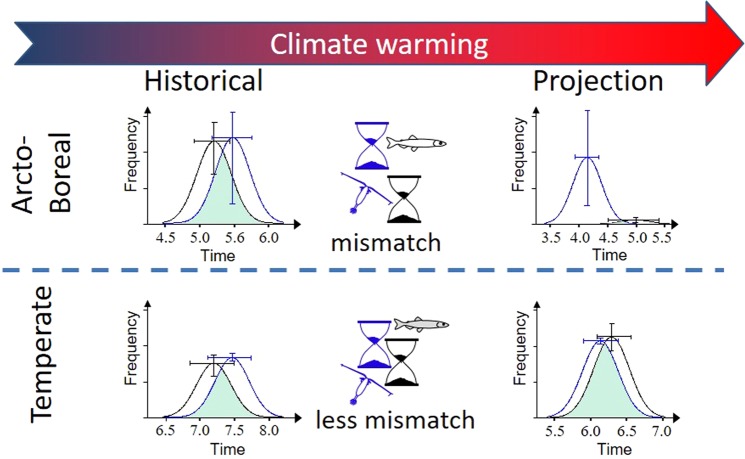
Figure 2.
Effect of climate change on match-mismatch and population change in two different biomes. The curves show mean hypothetical seasonal trends in food requirements of a predator population’s offspring (black) and the abundance of their prey (in blue) for the two biomes for historical (1980–2000) and future (2040–2060) periods. The bars show the interannual variability (the 0.2 and 0.8 quantiles). The x-axis is in months and the y-axis in arbitrary unit. The total food requirement (the area under the black curve) is assumed to scale with the abundance of adult predators (Supplementary methods). The overlap between the curves (green shaded area) gives an indication of the reproductive success of the predator, with larger overlap indicating stronger recruitment to the predator population9. A decrease of temporal asynchrony and/or an increase of prey relative to predator abundance increase overlap.

