Figure 1.
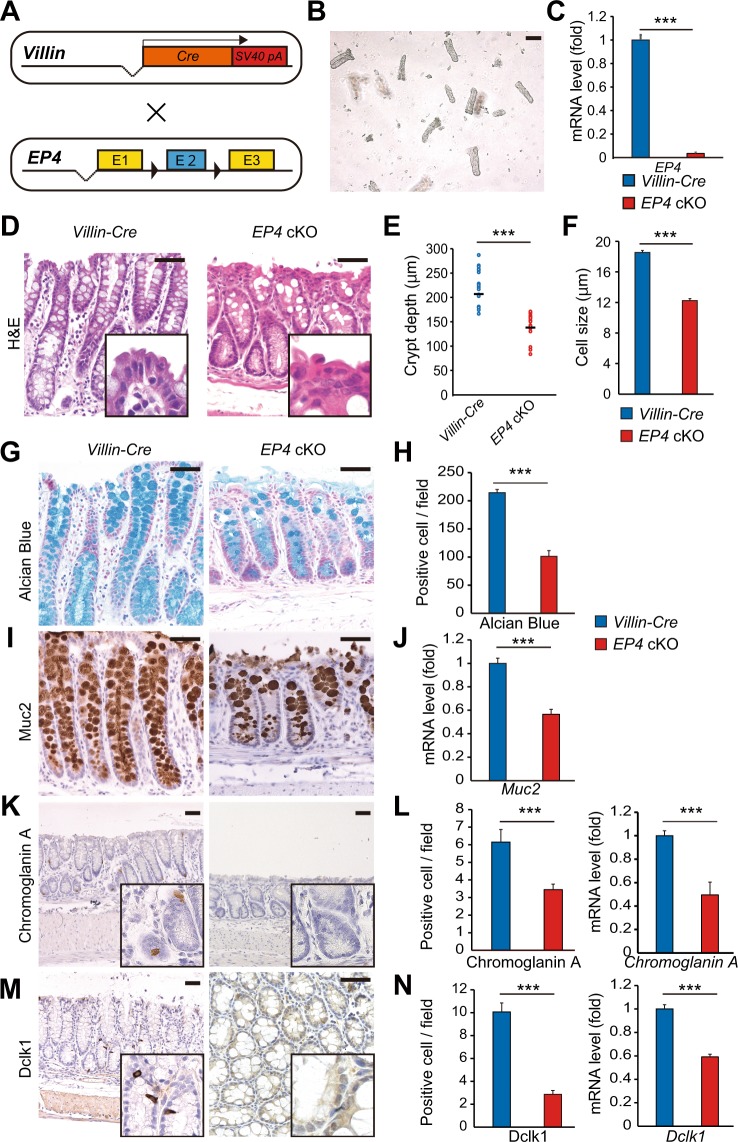
Colon homeostasis is impaired in epithelial EP4-deficient mouse. (A) Schema of recombination in Villin-Cre; EP4flox/flox mice. (B) Representative microscopic view of isolated crypts. Scale bars = 100 μm. (C) qRT-PCR analysis of EP4 mRNA levels in Villin-Cre (n = 5) and EP4 cKO (n = 5) colon crypts from the mice at 8 weeks of age. (D) Hematoxylin and eosin (H,E) staining of colon for Villin-Cre and EP4 cKO mice. Scale bars = 50 μm. (E) Crypt length in Villin-Cre and EP4 cKO mouse colons (n = 4). (F) Cell size of colonic epithelial cells located in the top of colon crypts in Villin-Cre and EP4 cKO mice (n = 3). (G,H) Alcian Blue staining and quantification in the colons from Villin-Cre and EP4 cKO mice at 8 weeks of age (n = 3). Scale bars = 50 μm. (I) Muc2 staining of colons in Villin-Cre and EP4 cKO mice at 8 weeks of age. Scale bars = 50 μm. (J) qRT-PCR analysis of Muc2 mRNA levels in Villin-Cre and EP4 cKO mice (n = 5). (K) Chromogranin A staining of colon in Villin-Cre and EP4 cKO mice at 8 weeks of age. Scale bars = 50 μm. (L) Quantification of (K) (n = 3) and mRNA expression levels of Chromogranin A in Villin-Cre and EP4 cKO mice (n = 4) analyzed by qRT-PCR on colon crypts. (M) Dclk1 staining of colon in Villin-Cre and EP4 cKO mice at 8 weeks of age. Scale bars = 50 μm. (N) Quantification of (M) (n = 3) and mRNA expression levels of Dclk1 in Villin-Cre and EP4 cKO colon crypts (n = 4) analyzed by qRT-PCR. Results are shown as mean ± SEM. ***P < 0.005.

