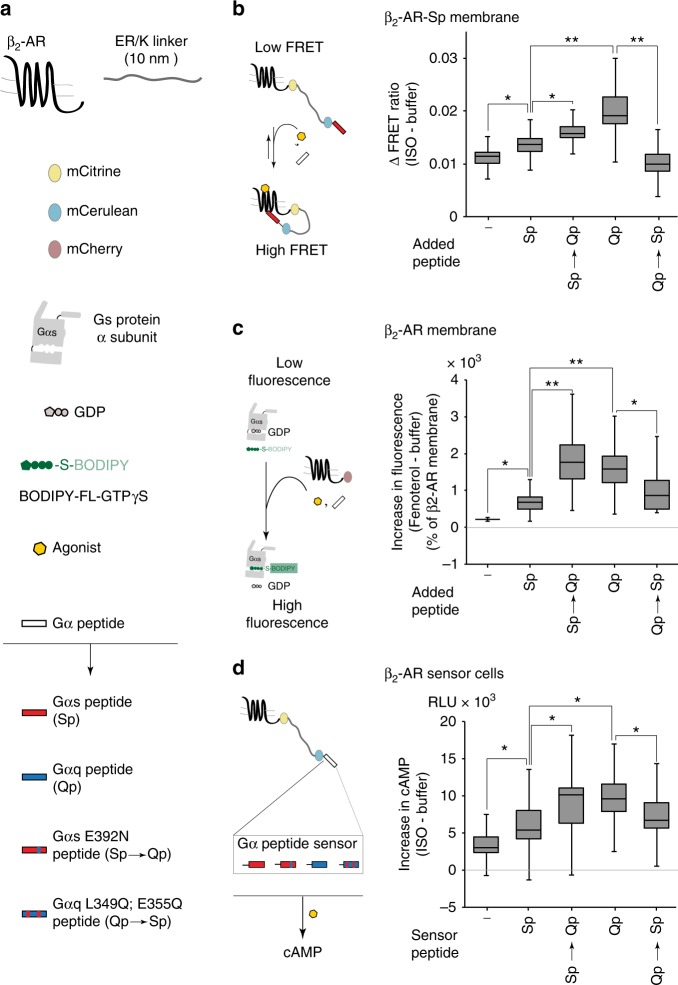
Fig. 2.
Switching receptor-interacting hotspot residues influences β2-AR priming. a Schematic list of proteins and protein domains used to assemble sensors for β2-AR and G-protein activation. The Gα peptides used are Sp (cognate), Qp (non-cognate), Sp → Qp (Sp mutant E392N, mimicking Qp), and Qp → Sp (Qp mutant L349Q, E355Q, mimicking Sp). b Left, schematic representation of an assay for using FRET to detect agonist-stimulated β2-AR activation using native membranes from HEK293 cells expressing β2-AR-Sp SPASM sensor in the presence of Gα peptides. Right, change in FRET ratio (mCit/mCer) following isoproterenol treatment (100 μM) of β2-AR-Sp sensors in the presence of the indicated Gα peptides. Qp and Sp → Qp peptide result in increased β2-AR activation. c Left, assay schematic for measuring G-protein activation by agonist-stimulated β2-AR in the presence of Gα peptides using BODIPY-GTPγS. Right, G-protein activation measured from the increase in BODIPY-FL-GTPγS fluorescence following fenoterol treatment (10 μM, 3 min) in urea-stripped membranes from HEK293T cells expressing β2-AR-mCherry, and containing purified Gαs (100 nM) and the indicated Gα peptides (10 μM). Values are expressed relative to G-protein activation by membrane in the absence of peptide (−). Qp and Sp → Qp peptide result in enhanced Gαs activation. d Left, SPASM sensors, tethering β2-AR to the individual Gα peptides, used for transfection into HEK293T cells. Cells expressing equivalent amount of sensor were analyzed for agonist-stimulated downstream signalling. Right, cAMP accumulation in cells expressing equivalent amounts of the indicated β2-AR–Gα peptide SPASM sensors following stimulation with isoproterenol (ISO, 10 μM) for 5 min. Qp and Sp → Qp peptide sensors enhance cAMP levels. Box-and-whisker plots: center line is median, box ends are upper and lower quartiles, whisker ends are 1.5 × interquartile range (IQR) from four independent experiments with at least three replicates per experiment (n ≥ 4). Statistically significant differences were assessed by a one-way ANOVA, followed by Tukey’s post-hoc test. Significance is denoted by asterisks, *p < 0.05; **p < 0.01

