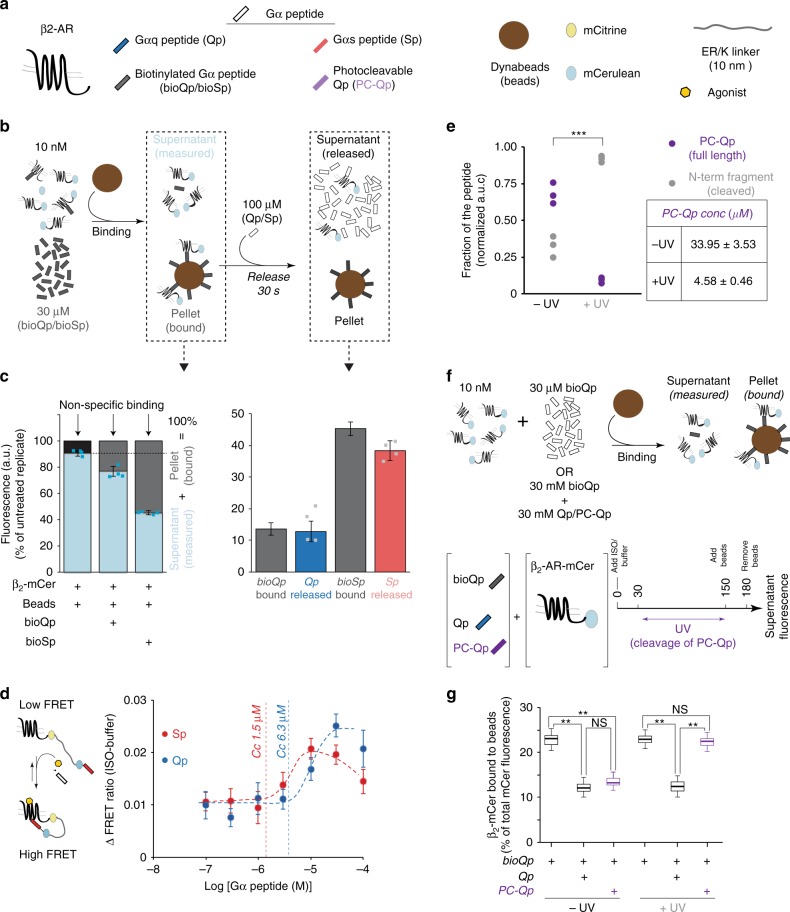
Fig. 3.
Weak, transient interactions with Gα peptides increase β2-AR priming. a Schematic list of reagents used to measure Gα peptide–GPCR interaction. b Representation of affinity pull-down and release assay for monitoring the interaction strength of Qp with β2-AR-mCer. c mCer fluorescence quantification of supernatants estimate extent of bioQp and bioSp binding to the receptor. Only 13% of β2-AR-mCer was specifically pelleted by binding to bioQp and all the bound receptors were completely released by excess Qp in 30 s. bioSp bound to 45% of the receptor and most of it was released by an excess of the Sp. Values are mean ± SD from three independent experiments with three repeats per experiment (n = 3). d Left, ΔFRET assay for agonist-stimulated β2-AR activation, in the presence of Gα peptides, using native β2-AR-Sp sensor membranes. Right, measuring the effect of Gα peptide (Sp/Qp) concentration on ISO-stimulated (100 μM) ΔFRET ratio of β2-AR-Sp sensors. Critical concentration (CC) to elicit response is indicated. Values are mean ± SD from four independent experiments with at least four repeats per experiment (n ≥ 4). e Quantification of the extent of photocleavage of PC-Qp by MALDI-MS. UV irradiation of full-length PC-Qp in the presence of native membranes causes the concentration of the full-length PC-Qp to decrease to 4.58 μM, which is less than the critical concentration (CC) required for GPCR priming. Values are mean ± SD from three experiments. f Representation of a competition assay to monitor displacement of PC-Qp (fragments) from native membranes expressing β2-AR-mCer. g Presence of Qp or intact PC-Qp competes with bioQp for binding to the receptor. Thirty seconds after UV irradiation, PC-Qp no longer competes with bioQp for interaction with the receptor. Values are from at least 12 replicates across 3 experiments Box-and-whisker plots: center line is median, box ends are upper and lower quartiles, whisker ends are 1.5 × interquartile range (IQR) from four independent experiments with at least three replicates per experiment (n ≥ 4). Statistically significant differences were assessed by a one-way ANOVA, followed by Tukey’s post-hoc test. Significance is denoted by asterisks, NS-not significant, ***p < 0.001, **p < 0.01

