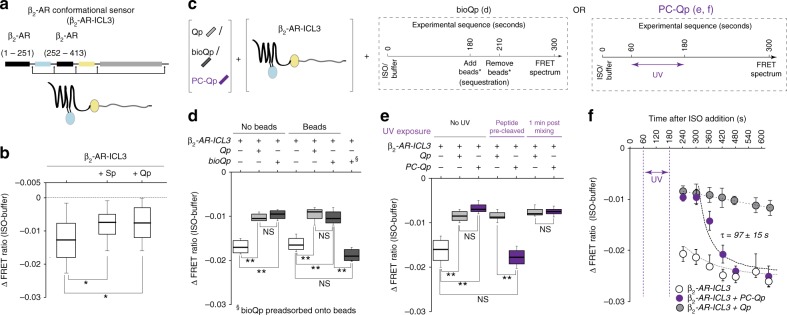
Fig. 5.
Temporal persistence of β2-AR conformational changes following Qp sequestration. a Design of β2-AR conformational sensor (β2-AR-ICL3), based on intramolecular FRET between mCer (donor) located in ICL3 and mCit (acceptor) inserted at the C terminus of the receptor. b Agonist-stimulated changes in β2-AR conformation monitored by ΔFRET ratio using native membranes containing β2-AR-ICL3 sensor, in the presence or absence of Gα peptides. c Schematic of ΔFRET assay to monitor time dependence of agonist-stimulated changes in β2-AR conformation, using native β2-AR-ICL3 sensor membranes, after depletion of Qp; center, sequestration of bioQp using Dynabeads; right, cleavage of PC-Qp using UV exposure. d ISO (100 μM)-induced ΔFRET ratio of β2-AR-ICL3 sensors in the presence or absence of Gα peptides, with and without treatment with Dynabeads that sequester bioQp. § indicates treatment of membranes with supernatant from bioQp preadsorbed onto Dynabeads. e ISO (100 μM)-induced ΔFRET ratio of β2-AR-ICL3 sensors in the presence or absence of Gα peptides (Qp- 30 μM or PC-Qp- 50 μM), with and without UV treatment that cleaves PC-Qp, but does not affect Qp. Photocleavage of PC-Qp before addition to membrane (pre-cleaved) abrogates the ΔFRET response relative to Qp (not photolabile), whereas photocleavage after mixing PC-Qp with membrane maintains the ΔFRET response. f Temporality of agonist-induced ΔFRET ratio of β2-AR-ICL3. Membranes containing the β2-AR-ICL3 sensor mixed with either no peptide (open circles), Qp (30 μM; grey circles), or PC-Qp (50 μM; purple circles) were treated with either ISO (100 μM) or buffer for 1 min, followed by UV exposure for 2 min. FRET spectra were acquired at increasing time intervals, starting at 30 s after UV exposure (210 s) and ΔFRET ratio calculated. Values are mean ± SD from three independent experiments with at least four replicates per experiment (n ≥ 3). Box-and-whisker plots: center line is median, box ends are upper and lower quartiles, whisker ends are 1.5 × interquartile range (IQR) from four independent experiments with at least three repeats in replicates per experiment (n ≥ 4). Statistically significant differences were assessed by a one-way ANOVA, followed by Tukey’s post-hoc test. Significance is denoted by asterisks, NS-not significant, *p < 0.05; **p < 0.01

