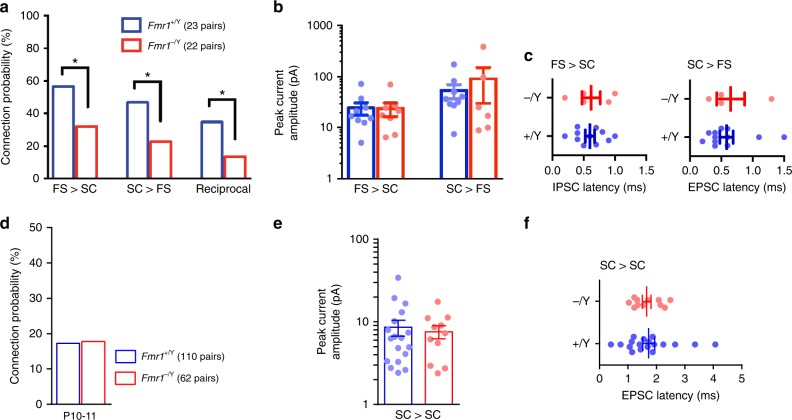
Fig. 2.
Reduced FS IN–SC connectivity in Fmr1-KO, but no change in connection properties. a Monosynaptic connection probability between pairs of FS and SCs tested with paired whole-cell recording. Asterisks: p < 0.05, Chi-squared test. b, c Connection strengths (b), peak evoked monosynaptic current amplitude and current onset latencies (c) for connected pairs shown in (a). No differences in connection strength between genotype were observed for either connection direction (p > 0.05, Mann–Whitney, N’s as in (a)). d Monosynaptic connection probability between pairs of SCs located within the same barrel for recordings in slices taken from P10–11 mice of each genotype. No change in connection probability was observed (p > 0.05, Chi-squared test). Not shown: Significant reduction in SC–SC connectivity for Fmr1−/Y at P12–15 (37/110, 8/54 tested pairs connected for Fmr1+/Y and Fmr1−/Y, respectively, χ2(1) = 7.78, p < 0.01). e, f No change in synaptic strengths (e) or peak monosynaptic EPSC amplitude (f) between the connected SC pairs from P10–11 Fmr1+/Y and Fmr1−/Y littermate mice shown in (d) (p > 0.05, Mann–Whitney, N’s as in (a))

