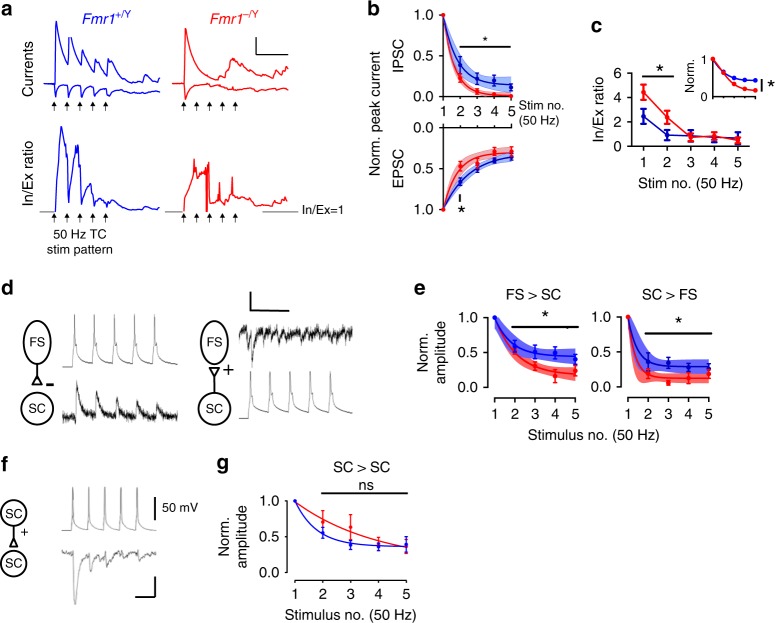
Fig. 4.
Synapse-specific changes to short-term plasticity in P10–11 Fmr1-KO mouse. a Top: Example voltage-clamped synaptic currents during repetitive TC stimulation at 50 Hz. Note strong amplitude attenuation of TC-evoked and FFI currents in Fmr1−/Y. Bottom: Instantaneous G/A ratios for the above traces calculated by dividing FF-IPSC amplitudes by EPSCs for each sampled point in time. Note: (1) the graded attenuation of G/A ratio in the Fmr1+/Y and slow onset of G/A balance during stimulus train despite large amplitude FF-IPSC, (2) Temporally disorganised ratio in the Fmr1−/Y. Arrows show stimulation times. Scale: 50 ms/100 pA, G/A = 1. b Short-term depression of EPSCs and FF-IPSCs during 5 × 50 Hz stimulation: Evoked current amplitudes normalized to steady-state amplitude. Error bars: mean ± SEM normalized peak amplitude after for each stimulus for Fmr1+/Y (blue, N = 19 (EPSCs) and N = 11 (FF-IPSCs) neurons) and Fmr1−/Y (red, N = 15 (EPSCs) and N = 12 (FF-IPSCs) neurons). Asterisks: significantly different stimulus responses between genotypes (t-test, p < 0.05). Shaded regions are best ± 95% CI fits to bi-exponential decay functions. For both EPSCs and FF-IPSCs, the rate of depression for Fmr1−/Y responses was faster and a single (i.e. common) fit could not adequately explain the behaviour of both genotypes (Extra sum-of-squares F-test, EPSCs: p = 0.0007, F(2,163) = 7.65, IPSCs: p = 0.0002, F(2,111) = 9.45, N’s as above). c Data from (b) represented as stimulus-by-stimulus G/A ratios from FF-IPSCs by EPSCs. Inset shows data normalised to starting G/A ratios. Asterisks indicate stimuli with significant reductions in G/A ratio for Fmr1−/Y data (t-test, N’s as in (b)). d Example short-term depression (50 Hz stimulus frequency) of unitary connections between FS-SC and SC-FS neurons (left, right) from paired recordings. Single trials shown. Scale: 50 mV, 10 pA/50 ms. e Short-term plasticity analysis in (b) but for unitary connections tested between connected pairs of FS and SC neurons (Asterisks: p < 0.05, t-test, fits: (p < 0.05, Extra sum-of-squares F-test N: FS to SC Fmr1+/Y = 9, Fmr1−/Y = 8, SC to FS: Fmr1+/Y = 9, Fmr1−/Y = 6). N’s indicate neurons). f As for (d) but for example connected SC–SC paired recording. Scale: 50 mV, 5 pA/25 ms. g Short-term depression of SC–SC connections was indistinguishable between genotypes (p < 0.05, t-test, N = 17 Fmr1+/Y, 11 Fmr1−/Y)

