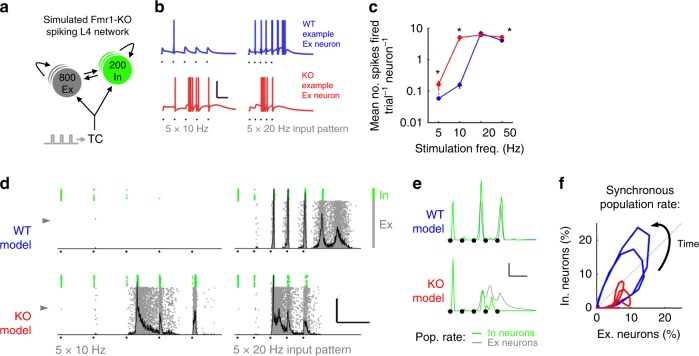
Fig. 9.
A Fmr1-KO layer 4 model reproduces features of the network response to TC input. a Schematic of model circuit comprising recurrently connected pools of Ex and In neurons receiving simulated thalamocortical input. b Simulated membrane potential for two example Ex neurons (indicated by grey arrowheads in (d)) for TC input at 10 and 20 Hz stimulation frequency. Black dots indicate stimulus times. Scale: 100 ms/50 mV. c Frequency-dependent spike output of model Ex neurons. Asterisks denote significantly different spike mean spike counts between models (p < 0.05, t-test, 800 neurons per model, 5 random models, average of 10 trials each). d Exemplar full network spike rasters for Ex and In neurons (grey and green, respectively) showing firing patterns in response to 5 × 10–20 Hz model thalamocortical stimuli. Population histograms of Ex neurons overlaid in grey. Scale: 100 ms, 50% Synchrony. e Grand mean Ex (grey) and In (green) population spike density functions (5 random seeds, 10 repeats each) from Fmr1+/Y and Fmr1−/Y simulations. Note impaired E–I population interaction in Fmr1-KO simulations. f Phase plot summarizing rhythmic Ex–In population interaction in Fmr1+/Y and Fmr1−/Y models. Note reduced global synchrony and impaired recruitment of Inhibitory neurons in Fmr1−/Y model

