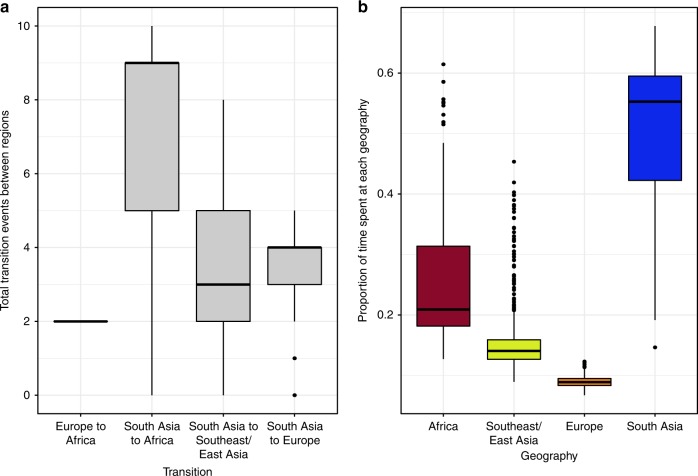
Fig. 3.
Phylogeographical inference of CenAsiaIII Shigella sonnei. Stochastic mapping was used to estimate a the number of transitions between different geographical states: Africa, Southeast/East Asia, Europe, and South Asia, with transitions between states that are less than one considered non-significant and not represented in the plot, and b the proportion of time spent in each geographical state. In both panels, boxplots summarise results of 966 successful subsamplings of the phylogeny described in Fig. 1, and stochastic mapping was performed for each with 100 simulations

