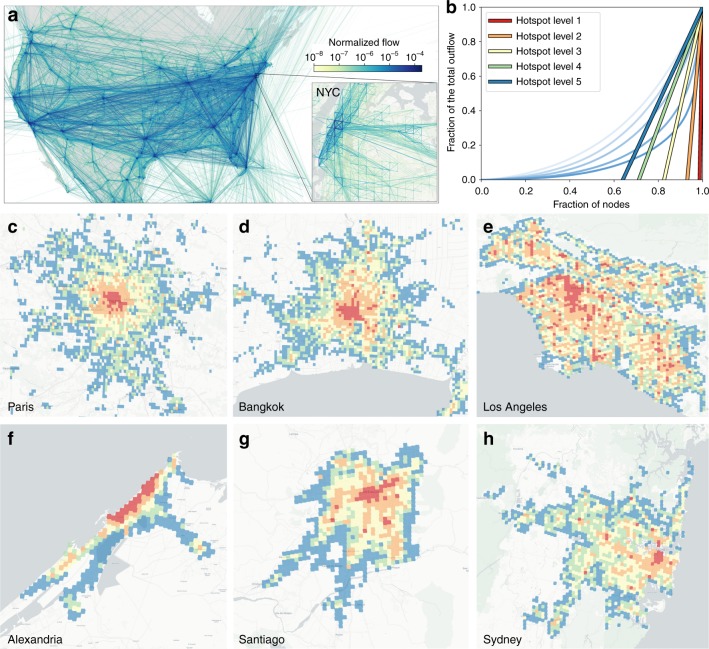
Fig. 1.
Human mobility and hierarchical structure of cities. a Mobility network extracted from North America (New York City shown in inset). Nodes are geographical units (S2 cells) and links are weighted by flows between locations with darker colors corresponding to more intense flows. b Hotspot level calculation using the Loubar method. c-h Maps of hierarchical hotspots for two groups of three metropolitan areas with similar population: c Paris (France) (12.4 million inhabitants), d Bangkok (Thailand) (14.5 million), e Los Angeles (USA) (13.35 million inhabitants), f Alexandria (Egypt) (5.17 million inhabitants), g Santiago (Chile) (7.11 million), and h Sydney (Australia) (5.13 million inhabitants). The color code is the same as in panel b: level 1 (dark red), level 2 (orange), level 3 (yellow), level 4 (green), and level 5 and below (dark blue). The underground map layout is produced using Carto. Map tiles by Carto, under CC BY 3.0. Data by OpenStreetMap, under ODbL

