Fig. 4.
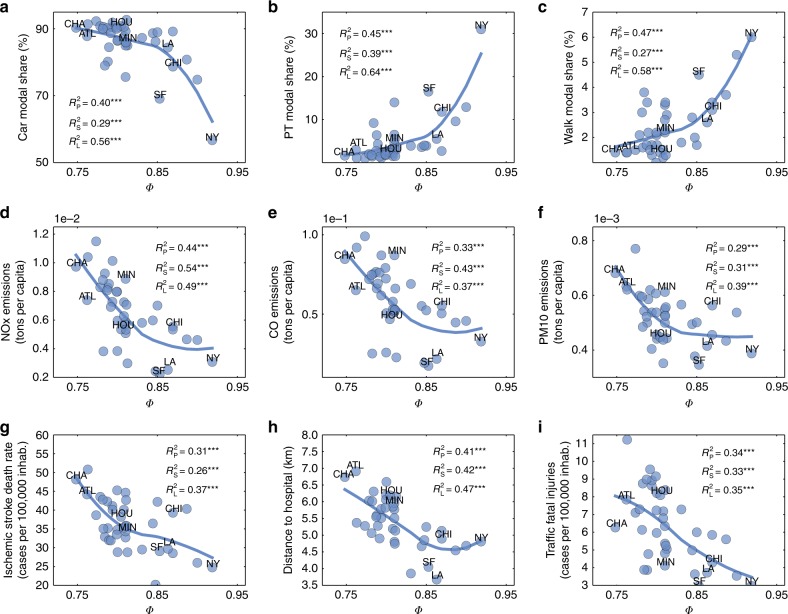
Connecting Φ with urban indicators in US cities. a–c Modal share for trips to work (%) as a function of Φ in US cities: a Modal share by private car, b by public transportation (PT) and c by walking. d–f Relation between Φ and pollutant emissions: d NOX, e CO and f PM10 in metric tons per capita. g–i Connecting Φ and health: g ischemic stroke mortality per 100,000 inhabitants, h average distance to closest hospital and i incidence of traffic fatalities per 100,000 residents. Correlations are measured using Pearson, Spearman, and LOESS with the corresponding explained variances denoted as , , and , (details in Supplementary Note 9). Asterisks correspond to significance-level (p value) of regressions (one * is less than 0.05, two less than 0.01, and three less than 0.001). Some city names appear in the plots: ATL (Atlanta), CHA (Charlotte), CHI (Chicago), HOU (Houston), LA (Los Angeles), MIN (Minneapolis), NY (New York City), and SF (San Francisco)

