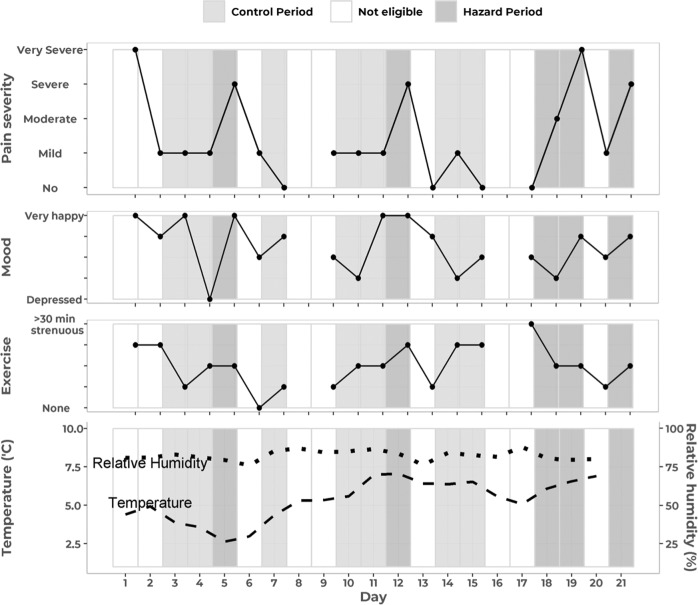
Fig. 3.
Example participant timeline of 21 days, showing participant-reported items (here, pain severity, mood, and exercise) and weather data (here, temperature and relative humidity). Pain events with their associated hazard periods (dark grey) occur when pain severity increases by two or more ordinal categories between consecutive days (e.g. from Day 4 to Day 5). Control periods (light gray) occur on days that were eligible to be a pain event, but where pain did not increase by two or more ordinal categories. Days where there was no recorded pain on the preceding day, or where the preceding day’s pain was severe or very severe (and could thus not increase by two or more categories), were not eligible to be pain-event days or control days. The case-crossover analysis compared the weather on pain-event days to weather on control days within a risk set of a calendar month

