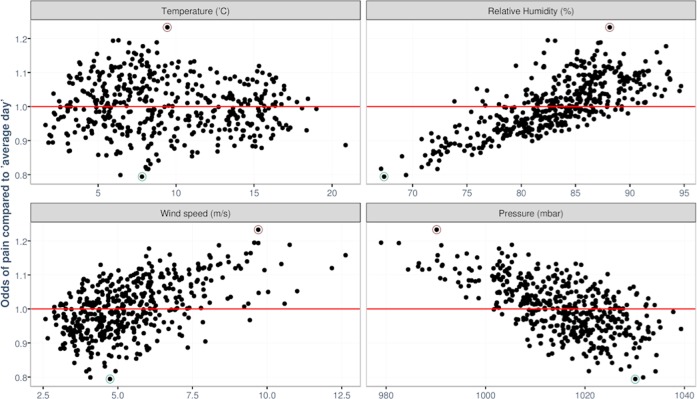
Fig. 5.
Estimated odds of a painful day for all weather days experienced during the 15 months. Estimated odds of a painful day are plotted as the odds ratio for each day compared to the average weather day in this period (temperature = 9.3 °C, relative humidity = 83%, wind speed = 4 m s–1 and pressure = 1013 mbar). Estimated odds are calculated from the output of the multivariable regression analysis. The day associated with the highest estimated odds of a pain event had a temperature of 9 °C, relative humidity 88%, wind speed 9.5 m s–1 and pressure 988 mbar. The day associated with the lowest estimated odds of a pain event was when the temperature was 7 °C, relative humidity was 67%, wind speed 4.5 m s−1 and pressure 1030 mbar

