Figure 5.
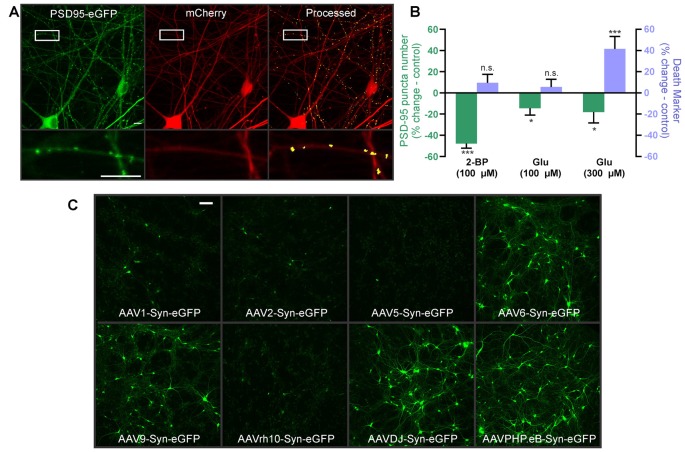
Automated synapse analysis in human induced pluripotent stem cell (iPSC)-derived neuronal cultures. (A) Representative confocal image of human iPSC-derived cortical neurons expressing HdAd-hSyn-PSD95-eGFP-hSyn-mCherry. Expression of the PSD95-eGFP fusion protein produces fluorescent puncta at excitatory synapses (green) and mCherry expression fills the cell and defines its morphology (red). Automated image processing was performed as described in Methods and puncta meeting size and intensity criteria were counted (yellow) and overlaid on the mCherry MIP (processed). Insets display enlarged images of the boxed regions. Scale bar: 10 μM. (B) Bar graph of change in synapse number (PSD95 puncta) and death marker (red mask particle number) from 0 to 24 h in neurons treated with 100 μM 2-BP, 100 μM glutamate, and 300 μM glutamate compared to respective untreated control wells. Data were collected using wide-field microscopy (nested unpaired t-test; t(4) = 3.947, p = 0.017 for puncta change, t(4) = 0.978, p = 0.383 for cell death, n = 36 ROIs from three wells for untreated, n = 35 ROIs from three wells for 100 μM 2-BP. Nested unpaired t-test; t(10) = 2.291, p = 0.045 for puncta change, t(10) = 0.849, p = 0.416 for cell death, n = 71 ROIs from six wells for untreated, n = 71 ROIs from six wells for 100 μM glutamate. Nested unpaired t-test; t(10) = 2.277, p = 0.024 for puncta change, t(10) = 2.214, p = 0.028 for cell death, n = 71 ROIs from six wells for untreated, n = 66 ROIs from six wells for 300 μM glutamate). ImageJ settings were as follows; Red MIP mask threshold: 0.5 × red MIP mean intensity, Red MIP threshold for particle number: Red MIP mean + 0.25 × SD, Puncta threshold: green MIP mean + 5 × SD, puncta size restriction: 3–30 pixels. Data are expressed as mean ± SEM of each ROI, n.s. = not significant, *p < 0.05, ***p < 0.001 compared to respective untreated control wells. (C) Images representative of three wells show hSyn-driven expression of eGFP in human iPSC-derived cortical neurons transduced with the indicated adeno-associated viruses (AAV) serotypes. Scale bar: 100 μM.

