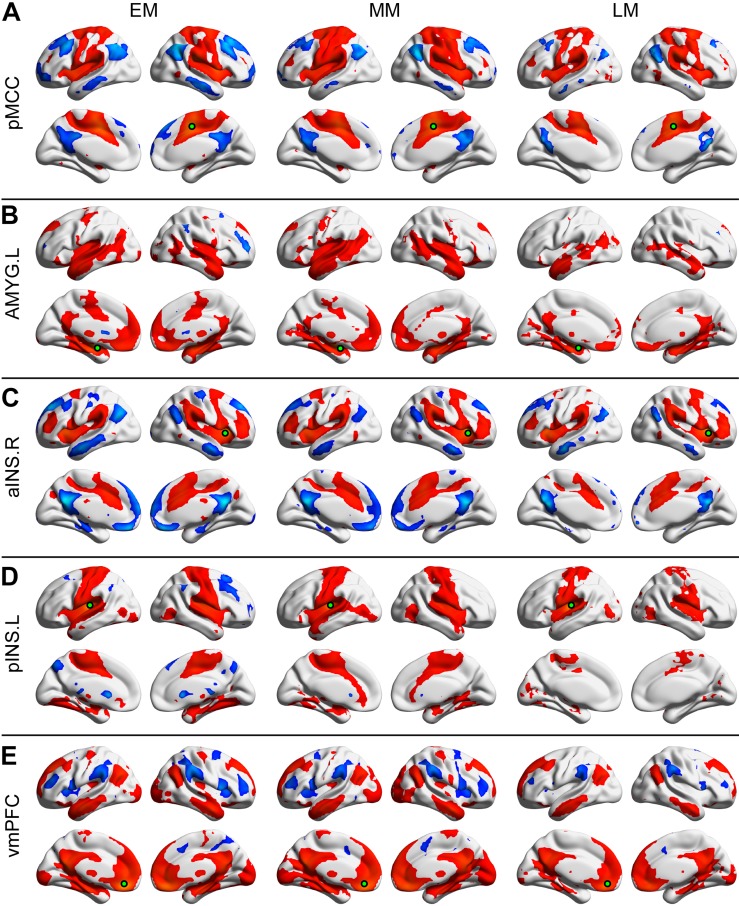
FIGURE 2.
Positive and negative functional connectivity maps seeded from the posterior midcingulate cortex (pMCC) (A), the left amygdala (AMYG) (B), the right anterior insula (aINS) (C), the left posterior insula (pINS) (D), and the ventromedial prefrontal cortex (vmPFC) (E) for the early- (EM, left column), middle- (MM, middle column), and late-adulthood males (LM, right column) (the seed was a 6 mm radius sphere shown in green; red and blue color indicated positive and negative connectivity maps, respectively, with a permutation test correction threshold of p < 0.05).

