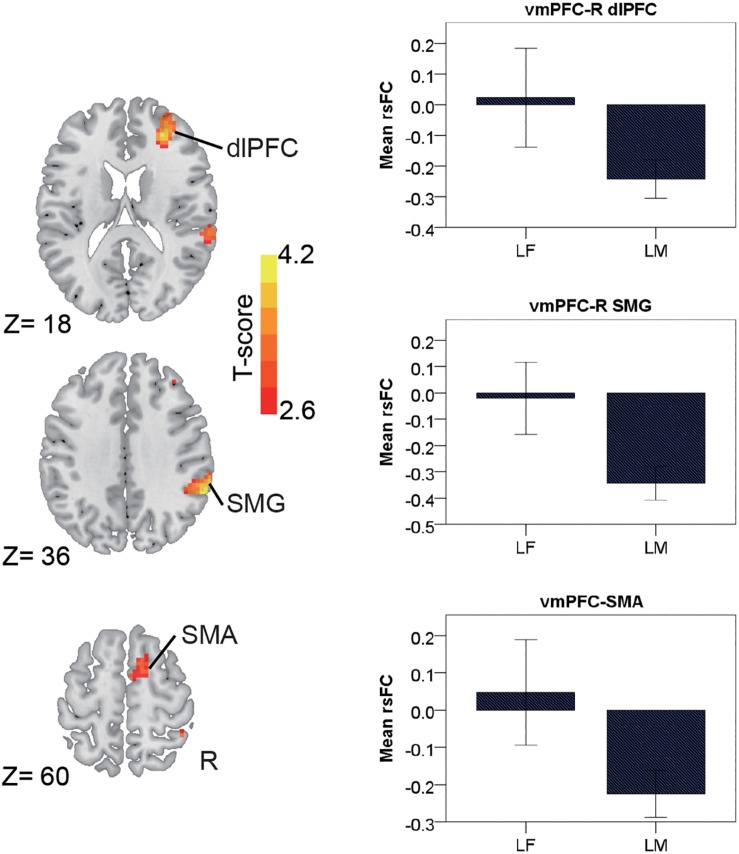
FIGURE 5.
Regions showing the gender differences in the late-adulthood stage detected by two-sample t-test (with a permutation test correction threshold of p < 0.05) in the vmPFC(–) network, each with the corresponding mean strength between the seed and region for the males and females shown in the bar plot, error bars indicated two standard errors (vmPFC, ventromedial prefrontal cortex; dlPFC, dorsolateral prefrontal cortex; SMG, supramarginal gyrus; SMA, supplementary motor area; R, right).

