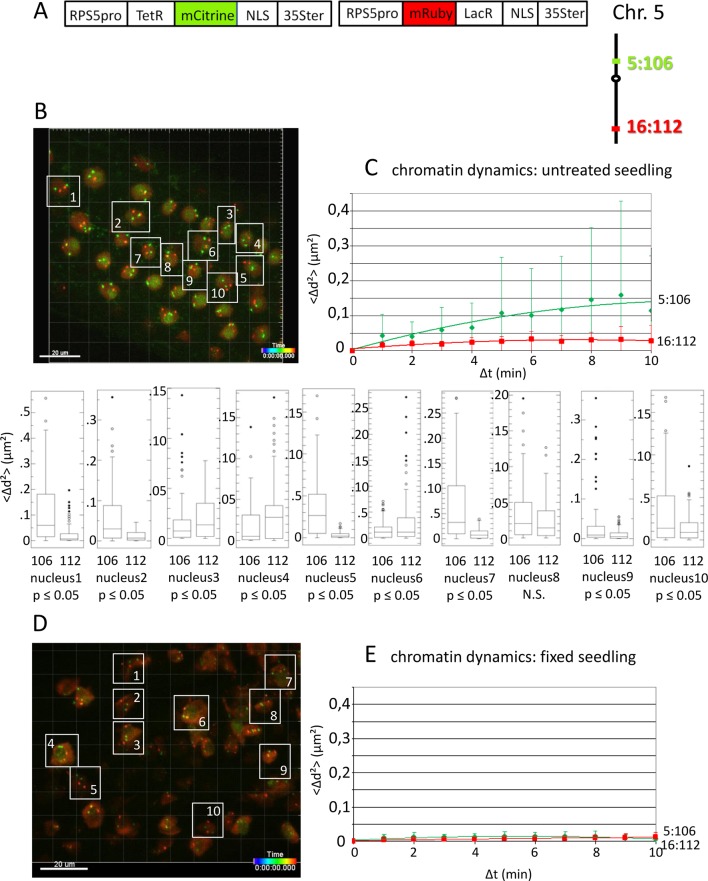
Figure 1.
Analysis of chromatin dynamics in untreated plants. (A) The construct encoded two nuclear-localized fusion proteins: TetR-mCitrine and mRuby-LacR (Data Sheet 1, combination Figure 1, in supplement). Both genes are under the transcriptional control of the RPS5A promoter (RPS5pro) and the 35S terminator (35Ster). NLS, nuclear localization signal. Right: TetR-mCitrine and mRuby-LacR fusion proteins bind, respectively, to tetO repeats at locus 5:106 and lacO repeats at locus 16:112. The two loci are integrated on the top and bottom arms of chromosome 5, respectively (green, locus 5:106; red, locus 16:112). (B) Left: Confocal image (maximum projection; enlargement in Data Sheet 9 in supplement) at time point t1 of fluorescent-tagged loci 5:106 and 16:112 in nuclei of cells in the root transition zone. Two red and two green dots are visible in most nuclei. Nuclei boxed in white were used to measure distances between the two red alleles and the two green alleles in the same nucleus. For confocal microscopy, Arabidopsis seedlings harboring these fluorescent-tagged loci were mounted on a slide in imaging buffer. One 3D data set, allowing measurement of allelic distances in Imaris, was acquired from both the red and green channels every minute (21 planes) over a time period of 10 min (Video 3). A total of 10 data records (one for each nucleus), each containing eleven time points, was analyzed (Table 2, sheets 1–2, in supplement). (C) Chromatin dynamics in living cells was determined by plotting the cumulative overall mean squared change in distance between the two alleles <Δd2>(μm2) against elapsed time intervals Δt. The plateau height of the trendline reflects the size of the confinement region. Higher plateau values indicate increased chromatin movement (Qian et al., 1991). The graph shows a scatterplot of the <Δd2> values (cumulated (squared) distance travel since t0) for 10 nuclei over a period of 10 min (Δt = elapsed time since t0) and is overlaid with order two polynomial trendlines and standard deviation bars are shown. The Δd2(μm2) rises to 0.14 for locus 5:106 and 0.03 for locus 16:112 during the 10-min data acquisition period in this experiment. These Δd2(μm2) values correspond to radiuses of confinement of 0.4 μm and 0.17 μm, respectively, in nuclei with an approximate diameter of 10 μm, which is in line with previous results (Marshall et al., 1997; Kato and Lam, 2003). Single nuclei box plot analyses and calculation of p values using the Δd2 values revealed nine nuclei with significantly different changes in chromatin mobility (p ≤ 0.05) between locus 5:106 and locus 16:112 (Table 3). N.S., not significant. (D) Same procedure as in part C using fixed seedlings as a negative control for “jiggling” of alleles. Left: nuclei boxed in white used for measurements (Table 2, sheets 3–4 in supplement). (E) Chromatin dynamics (fixed seedling): <Δd2>(μm2) of fixed seedlings against elapsed time intervals (Table 4, in supplement). Motion in living cells (part C) is greater than in fixed cells, indicating that the movement is not due to measurement error.

