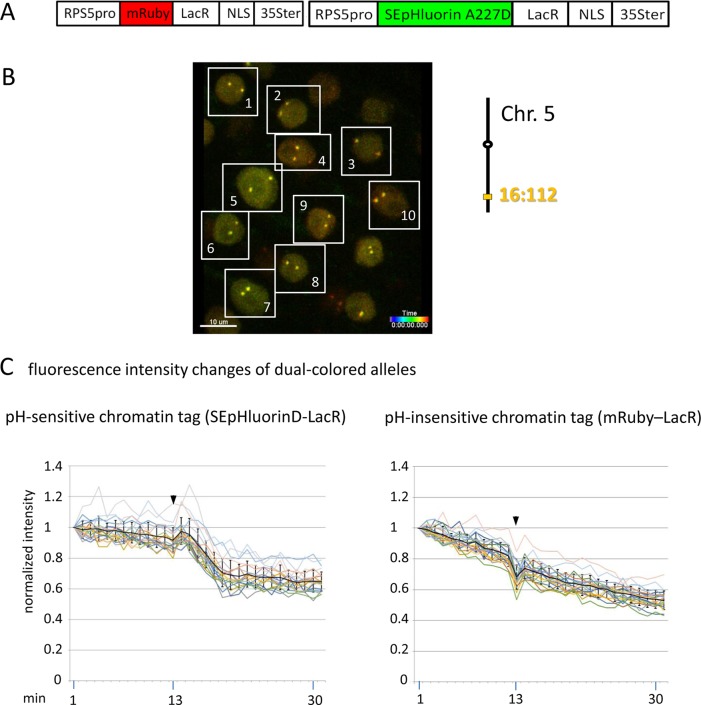
Figure 5.
Comparison of fluorescence intensity changes of pH-sensitive and pH-insensitive fluorescent DNA-binding proteins following addition of eATP. (A) The construct used in this experiment encoded a nuclear-localized SEpHluorinD-LacR fusion protein as a pH-sensitive fluorescent DNA-binding protein, and mRuby-LacR as a pH-insensitive DNA-binding protein. Both genes are under the transcriptional control of the RPS5 promoter and the 35ter (Data Sheet 1 , combination Figure 5, in supplement). Right: The SEpHluorinD-LacR fusion protein and the mRuby-LacR fusion protein both bind to the tandem lacO repeats integrated at locus 16:112 on the bottom arm of chromosome 5. (B) Confocal image (maximum projection; enlargement in Data Sheet 9 in supplement) of double fluorescent-tagged locus 16:112 at time point t1 in nuclei of cells in the root transition zone. Two yellow dots are visible in most nuclei. Nuclei used for fluorescence intensity analysis (part C) are boxed in white. (C) Fluorescence intensity changes of dual-colored alleles. Response of pH-sensitive tag SEpHluorinD-LacR (left) and pH-insensitive mRuby-LacR (right) to eATP addition (black arrowheads, frames 13-14). Fluorescence intensity profiles of normalized intensities of all 10 nuclei recorded in the green and red channels in the same experiment are overlaid in two separate graphs together with the calculated average values, to which standard deviation bars were added (Table 10, Data Sheet 6, in supplement). Normalized and non-normalized data can be viewed respectively, in Data Sheets 6 of Tables 10 and 1. Using the normalized data, the calculated difference in the magnitude of the drop in fluorescence intensity of SEpHluorinD-LacR versus mRuby-LacR between the time points 14 to 21 in response to eATP is statistically significant (p ≤ 0.05). The spike in fluorescence of the mRuby pH-insensitive tag reflects dislocation turbulence following eATP application. Fluorescence intensities of individual nuclei are shown in supplementary Data Sheet 8, part Figure 5C. ΔpH values are shown under each nucleus1-10 for both alleles [maximum ΔpH 0.5 (nucleus 5, one allele); minimum ΔpH 0.2 (nuclei 1, 2, 4, 6,9, one allele, nucleus 10 both alleles); average ΔpH 0.3 (n = 20)]. Fluorescence intensity at genomic location is read in spot objects (1–2.8 μm) capturing punctual fluorescence.

