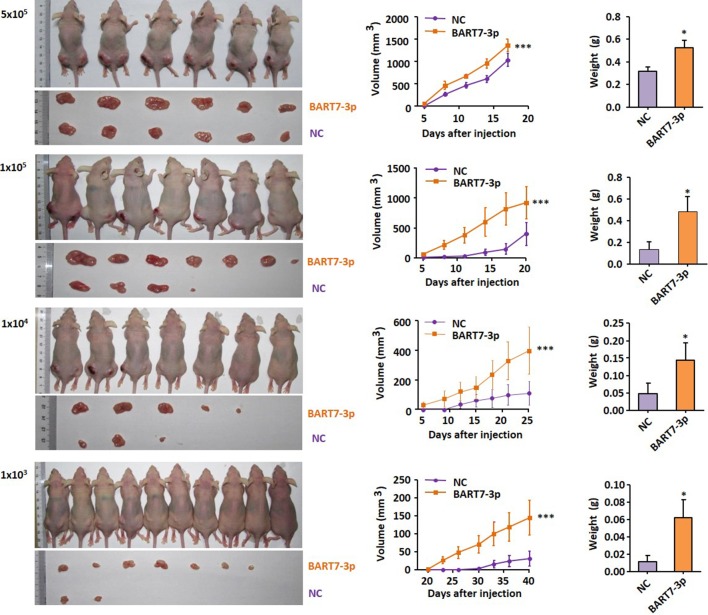
Figure 2.
CNE2-NC and CNE2-BART7-3P were inoculated subcutaneously into the left and right sides of the back of each nude mouse respectively at concentration spanning a 4-point scale (1×10³, 1×10⁴, 1×10⁵, 5×10⁵). The volume or weigh of xenograft tumors were shown in the bar chart (*P < 0.05, ***P < 0.001).

