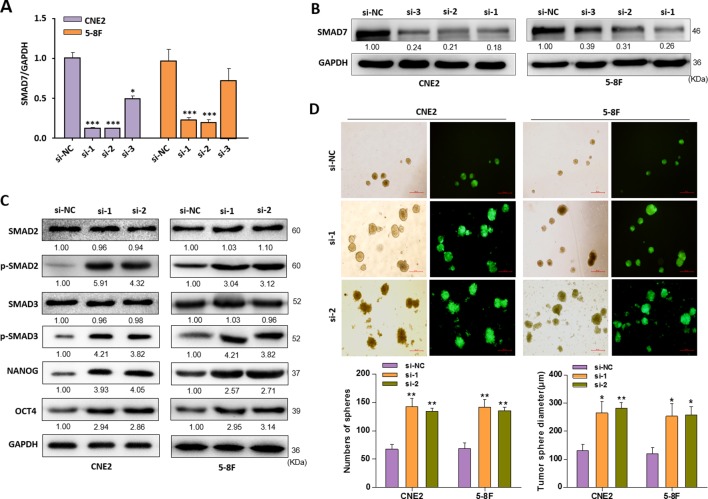
Figure 5.
Knockdown of SMAD7 mimicked the EBV-miR-BART7-3p-induced phenotype. (A, B) CNE2 and 5-8F cells treated with siRNAs (si-1, si-2, si-3) targeting SMAD7 were analyzed by Western blot and qPCR. GAPDH served as a loading control. (C) The expression of p-SMAD2, p-SMAD3 and stem-cell markers (NANOG, OCT4) were determined by Western blot in CNE2 and 5-8F cells treated with si-1 and si-2 against SMAD7 or si-NC. GAPDH was internal control. (D) Images showing tumor sphere formation in either si-SMAD7 or si-NC NPC cells (Magnification, ×20; scale bar, 500 um). Columns in chart show number of spheres counted in 9 fields for each group. (*P < 0.05, **P < 0.01, ***P < 0.001).

