Figure 6.
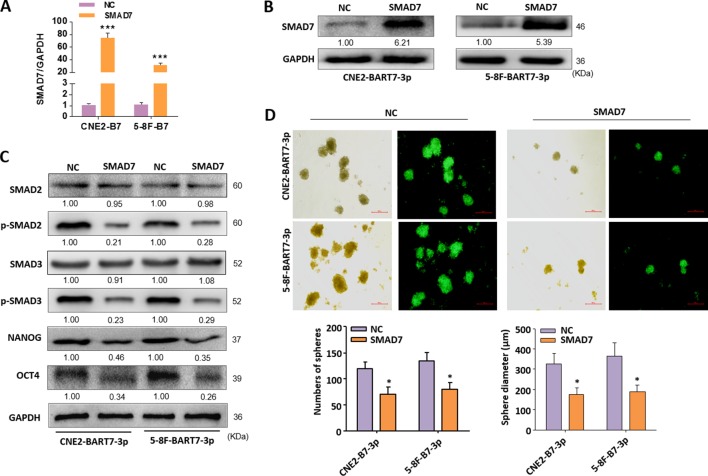
Functional validation of SMAD7 effects on EBV-miR-BART7-3p-mediated stemness phenotypes in NPC cells. (A, B) The expression of SMAD7 was detected by qPCR and Western blot in indicated cells transfected by SMAD7 expression plasmids. (C) The expression of p-SMAD2, p-SMAD3, NANOG and OCT4 in CNE2-BART7-3p and 5-8F-BART7-3p cells was measured by Western blot in the presence and absence of SMAD7. GAPDH served as the internal control. (D) Images showing tumor sphere formation in either CNE2-BART7-3p or 5-8F-BART7-3p cells transfected by SMAD7 expression plasmids (Magnification, ×20; scale bar, 500 um). Columns in chart show number of spheres counted in 9 fields for each group. (*p < 0.05, ***p < 0.001).

