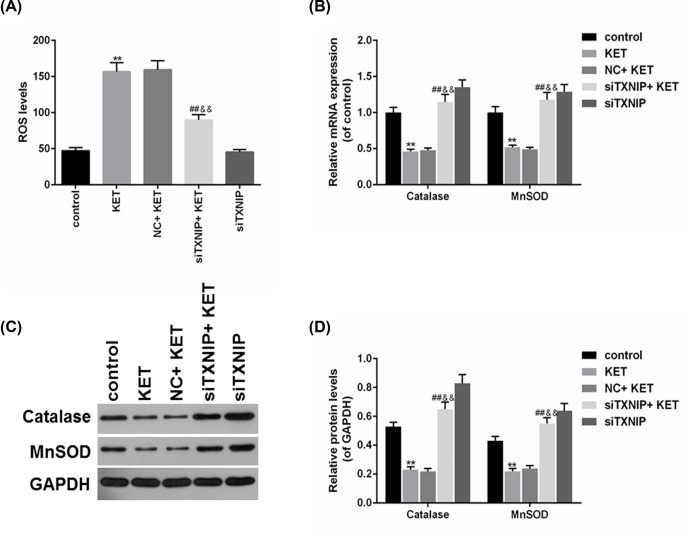
Figure 4. Knockdown of TXNIP reversed ROS production caused by ketamine in SV-HUC-1 cells.
(A) SV-HUC-1 cells ROS production was analyzed by flow cytometry. (B,C) The protein levels of Catalase and MnSOD were determined (B) and quantified (C) by Western blot. (D) The mRNA levels of Catalase and MnSOD were assessed by RT-qPCR. **P<0.01 vs. control, ##P<0.01 vs. KET, &&P<0.01 vs. NC+KET.

