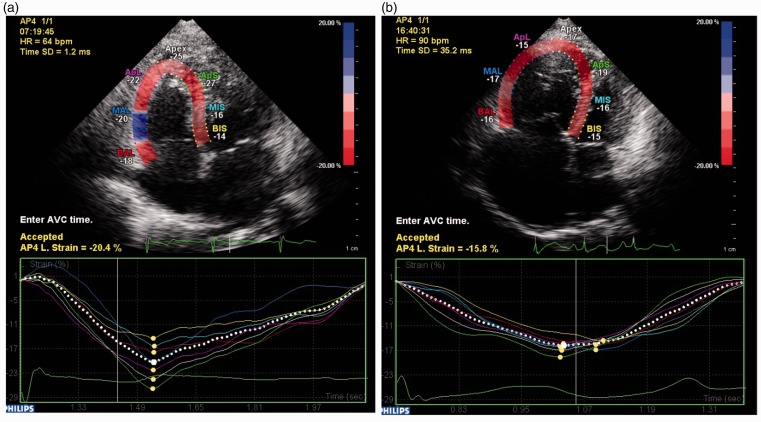
Fig. 1.
Speckle-tracking strain imaging using the apical four-chamber view to assess RV dyssynchrony. The segmental (colored lines) strain curves represent the relative (percentage) shortening of the six regions of interest as a function of time (in milliseconds). The yellow dots in the segment strain curved represent the peak systolic strain of the segments. (a) A six-segment model of the right ventricle in a control subject; (b) An example of a patient with idiopathic PAH with RV-SD4 = 35 ms.

