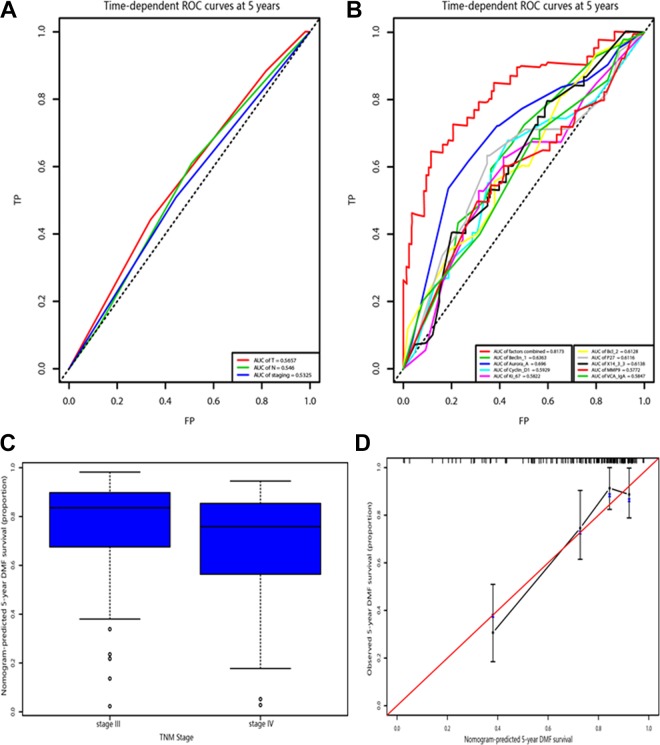
Figure 3.
A, Receiver operating characteristic curve for the TNM stage. B, Receiver operating characteristic curve for the model and the selected biomarkers. C, The box plot represents the distribution of nomogram-predicted 5-year survival according the TNM staging system. D, Calibration of the nomogram. The x-axis represents the nomogram-predicted survival, and the y-axis represents actual survival and 95% CIs measured by Kaplan-Meier analysis. CI indicates confidence interval; DMFS, distant metastasis-free survival; TNM, tumor–node–metastasis.

