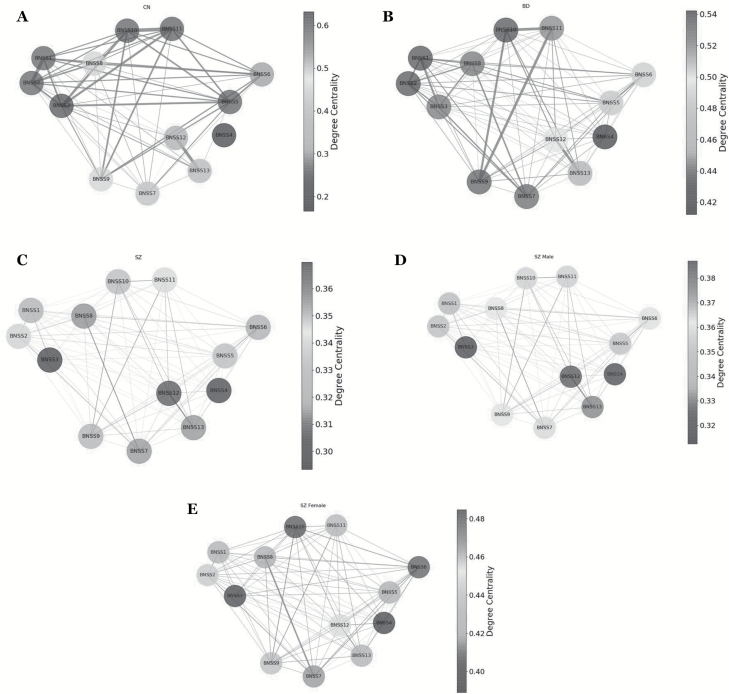
Fig. 4.
(A) Degree centrality results for controls. The nodes in the network represent the Brief Negative Symptom Scale (BNSS) symptoms; the node shades represent degree centrality; the edges represent connection between nodes. (B) Degree centrality results for bipolar disorder. The nodes in the network represent the BNSS Symptoms; the node shades represent degree centrality; the edges represent connection between nodes. (C) Degree centrality results for patients with schizophrenia. The nodes in the network represent the BNSS symptoms; the node shades represent degree centrality; the edges represent connection between nodes. (D) Degree centrality results for male patients with schizophrenia. The nodes in the network represent the BNSS symptoms; the node shades represent degree centrality; the edges represent connection between nodes. (E) Degree centrality results for female patients with schizophrenia. The nodes in the network represent the BNSS symptoms; the node shades represent degree centrality; the edges represent connection between nodes.

