
Figure 1.
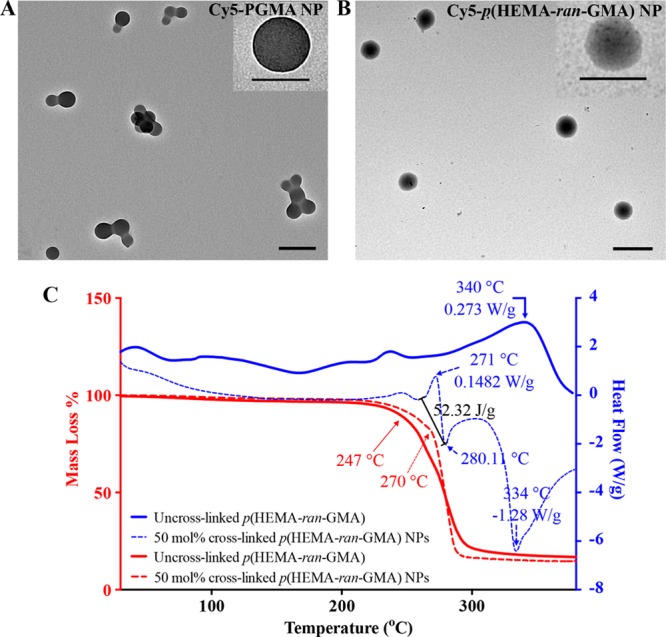
(A) Transmission electron microscopy (TEM) image of Cy5-PGMA nanoparticles (NPs). Scale bar = 200 nm. Inset: TEM image (top right), scale bar = 120 nm. (B) TEM image of p(HEMA-ran-GMA) nanoparticles. Scale bar = 500 nm. Inset: TEM image (top right), scale bar = 300 nm. (C) Thermal analysis of cross-linked p(HEMA-ran-GMA) nanoparticles with respect to p(HEMA-ran-GMA) polymer. Mass loss (%) was determined using thermogravimetric analysis (TGA) (in red), and heat flow assessment was performed using differential scanning calorimetry (DSC) (in blue) over a temperature range of 25 to 380 °C under inert conditions.